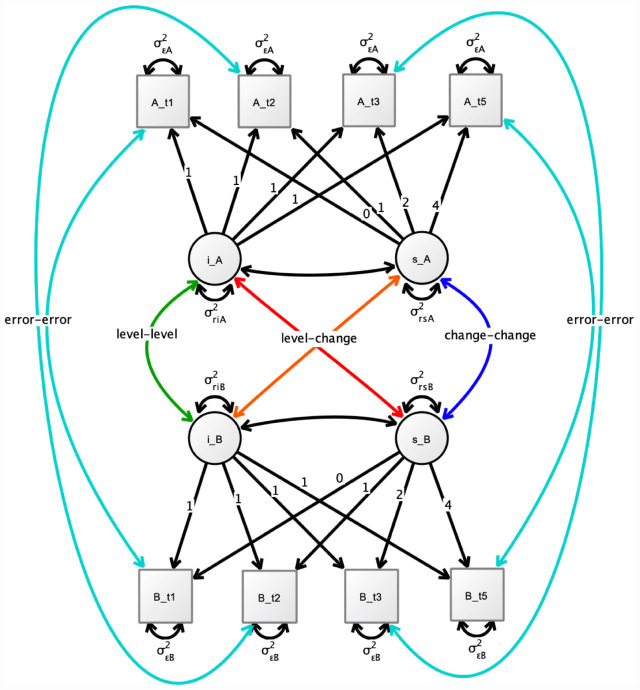
FIGURE 1.
Simplified illustration of the used bivariate growth model for two brain structures A and B. i_ = random intercept. s_ = random slope. Not shown are the included covariates on the intercept and slopes. Also, the separation of the time intervals into eleven time bins from 0 to 4.5 years is not illustrated. The main interest in our study was on the change-change associations between brain structures. t1: baseline, t2 = 1-year follow-up, t3 = 2-year follow-up, 5 = 4-year follow-up.

