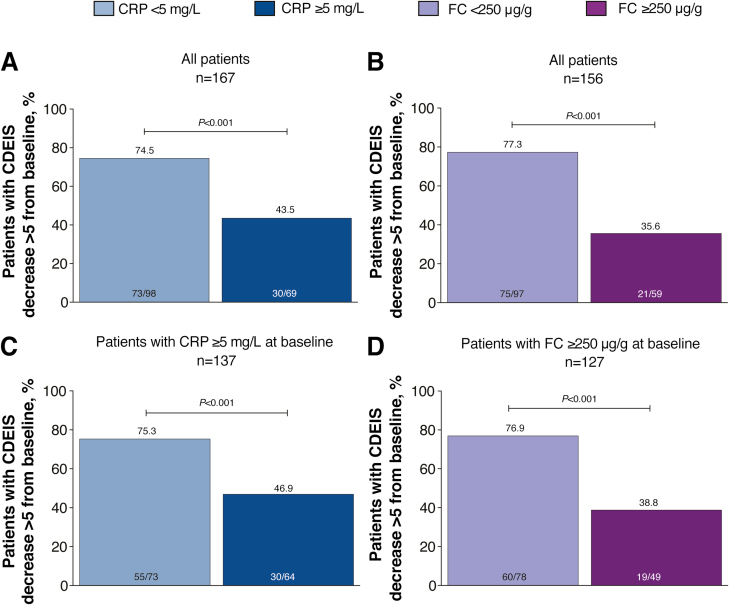
FIGURE 2.
Proportion of patients achieving endoscopic response (CDEIS decrease >5 from baseline) in (A) all patients by CRP cutoff at week 48 after randomization, (B) all patients by FC cutoff at week 48 after randomization, (C) patients with CRP ≥5 mg/L at baseline, and (D) patients with FC ≥250 µg/g at baseline. P values were calculated using the χ 2 test or Fisher exact test if ≥20% of the cells had expected cell count <5.

