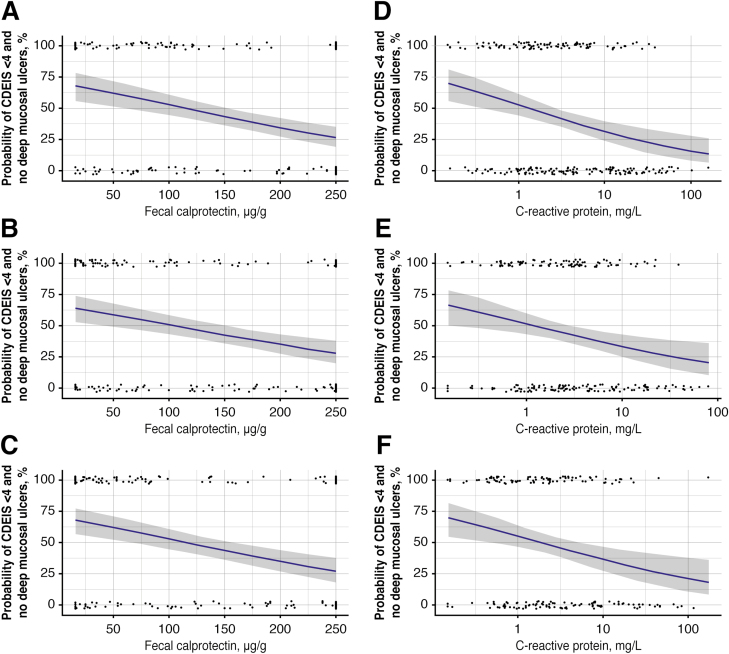
FIGURE 5.
Relationships of probabilities of achieving mucosal healing (CDEIS <4) and no deep ulcers versus stool concentrations of FC at weeks (A) 11, (B) 23, (C) 35, and serum concentrations of CRP at weeks (D) 11, (E) 23, and (F) 35. Dots represent the individual response status vs the corresponding biomarker concentration. Blue lines represent the relationship based on the fitted logistic regression model. The shaded regions represent the 95% CI of the relationship.

