
FIG. 2.
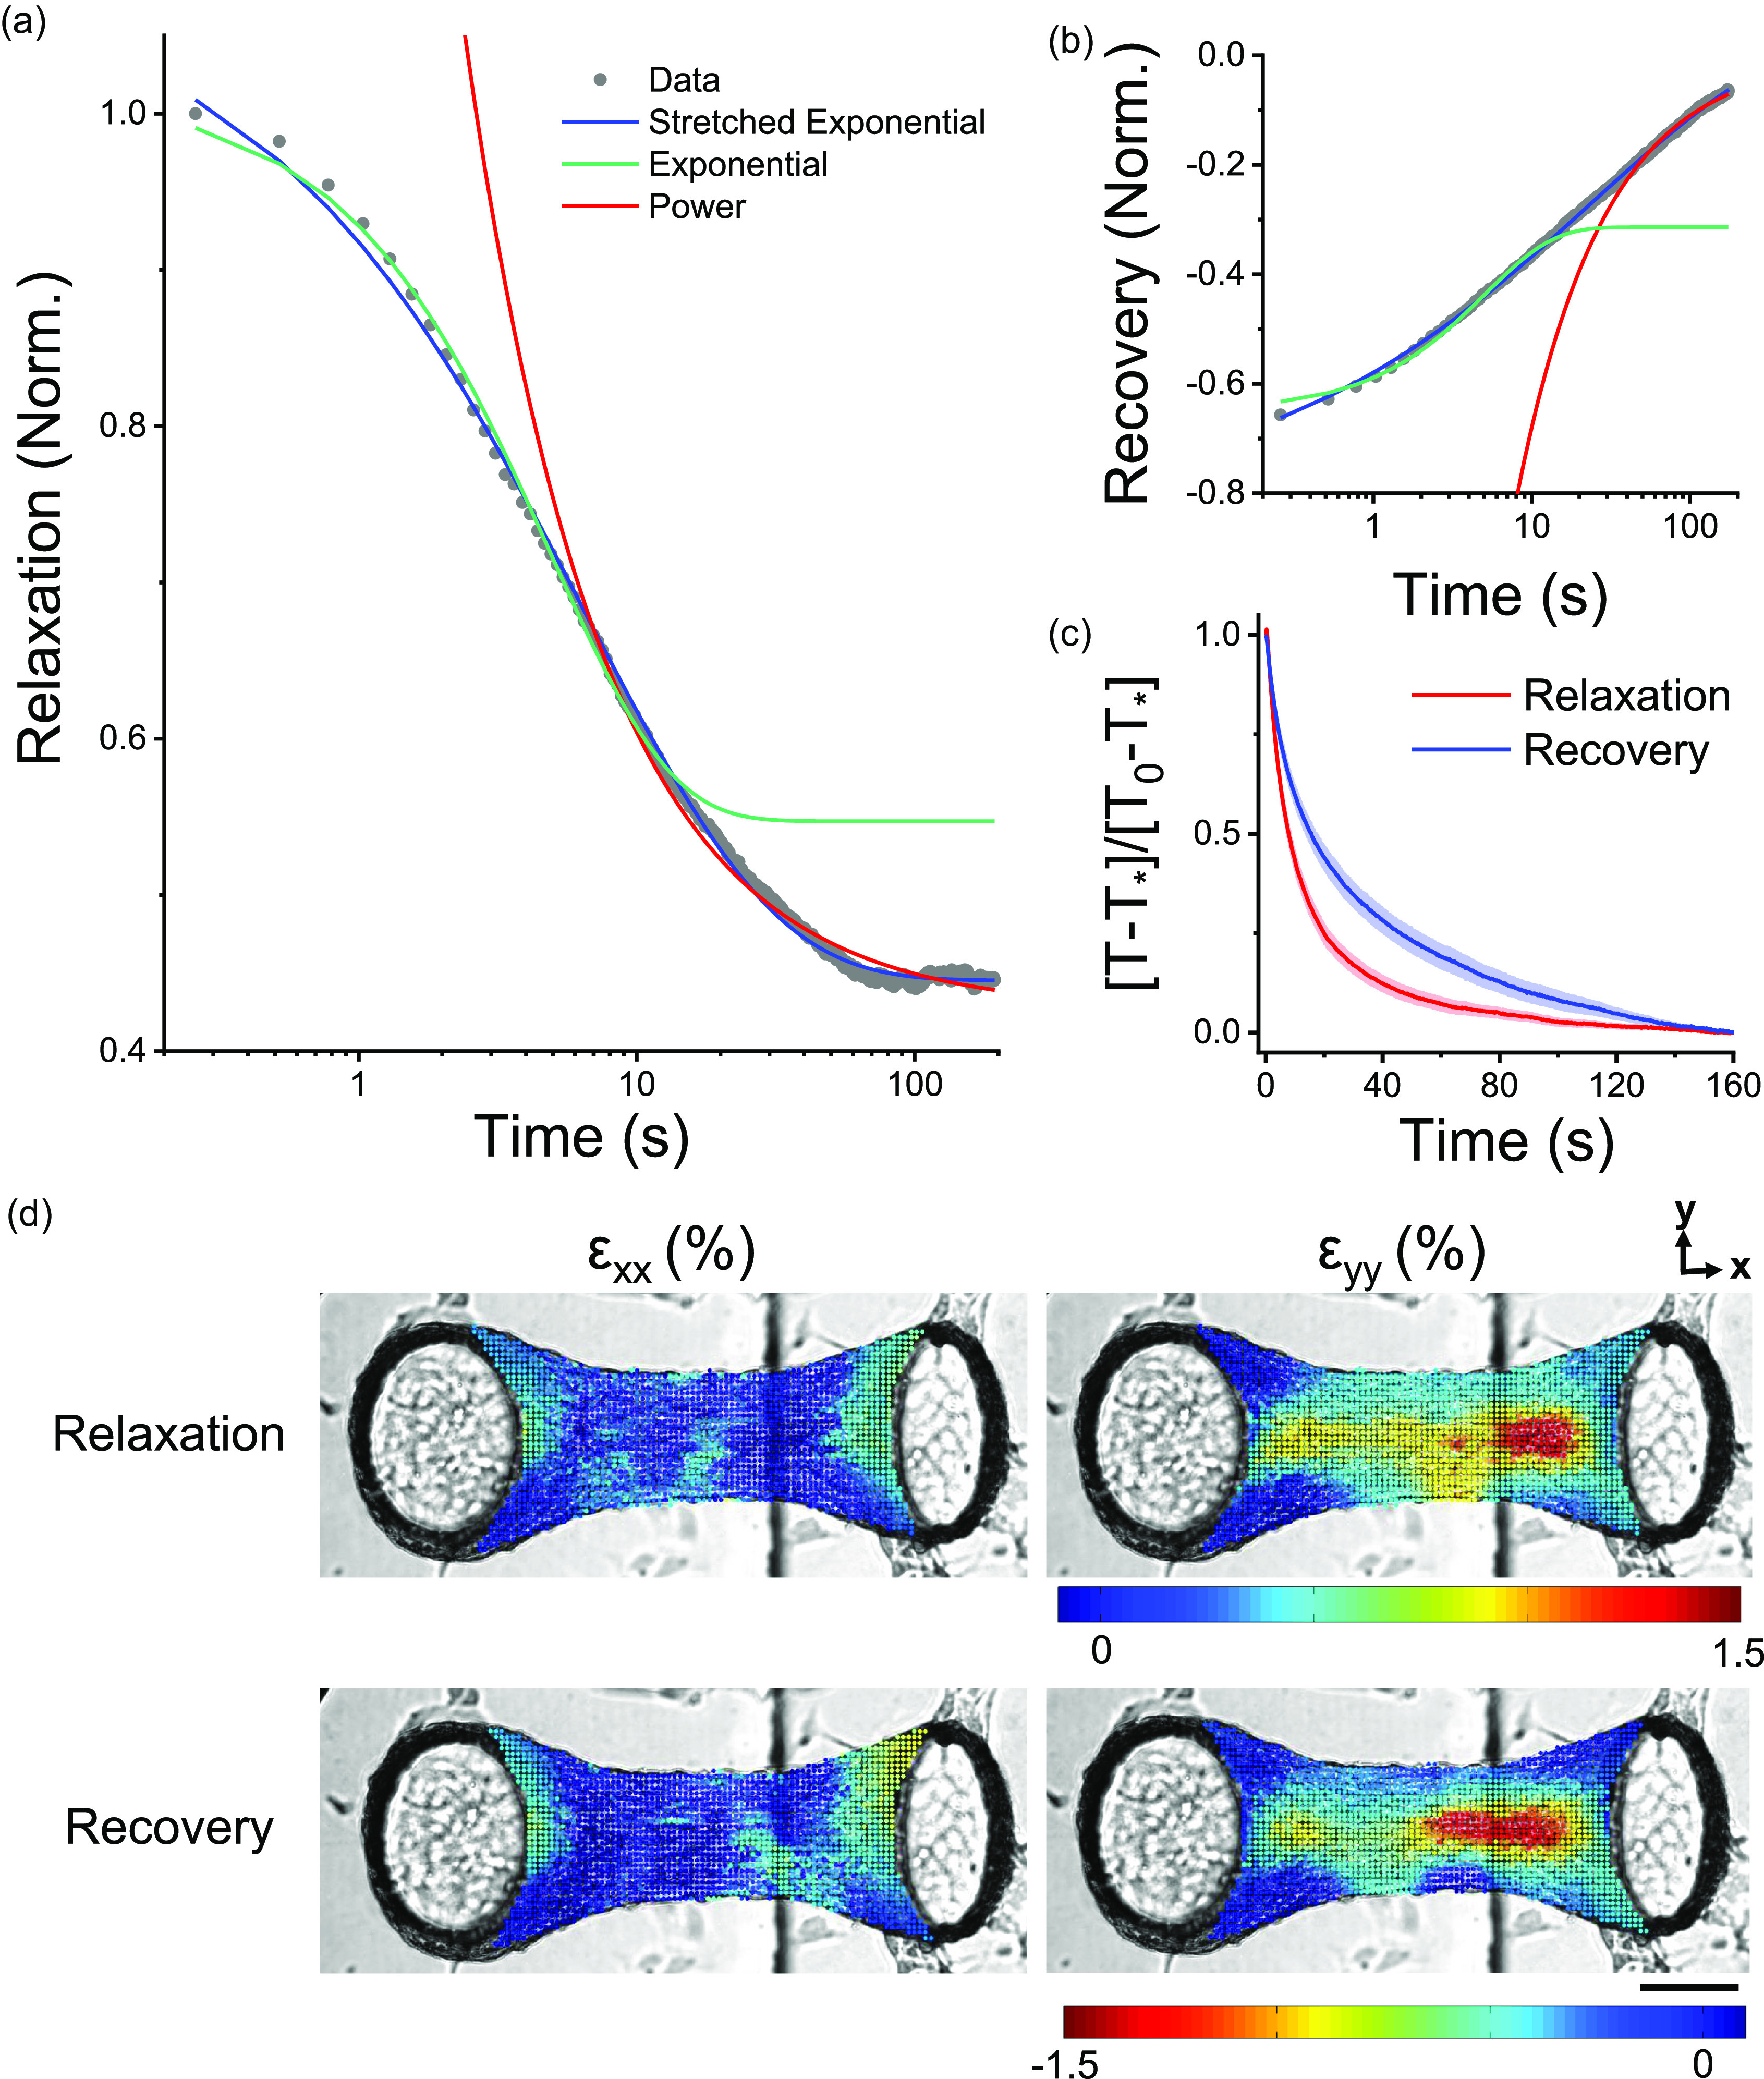
Stress relaxation and recovery in microtissues followed stretched exponential trajectories. Viscoelastic modeling of stress relaxation and recovery responses is shown in (a) and (b), respectively. In both panels, representative data were normalized to the peak tension. Stretched exponentials capture relaxation and recovery behaviors over three decades of time. To assess the dynamics of the relaxation and recovery, responses were normalized to their amplitudes using tension measurements immediately following step length changes, T0, and after 160 s, T*. By normalizing responses in this manner, it is clear that relaxation occurred much quicker than stress recovery (c). Yet, stress relaxation and recovery appeared to share the same spatial locations within a given microtissue in terms of both viscoelastic deformation in the longitudinal (εxx) and transverse (εyy) directions immediately following the change in the length (d). The scale bar represents 100 μm.