
FIG. 4.
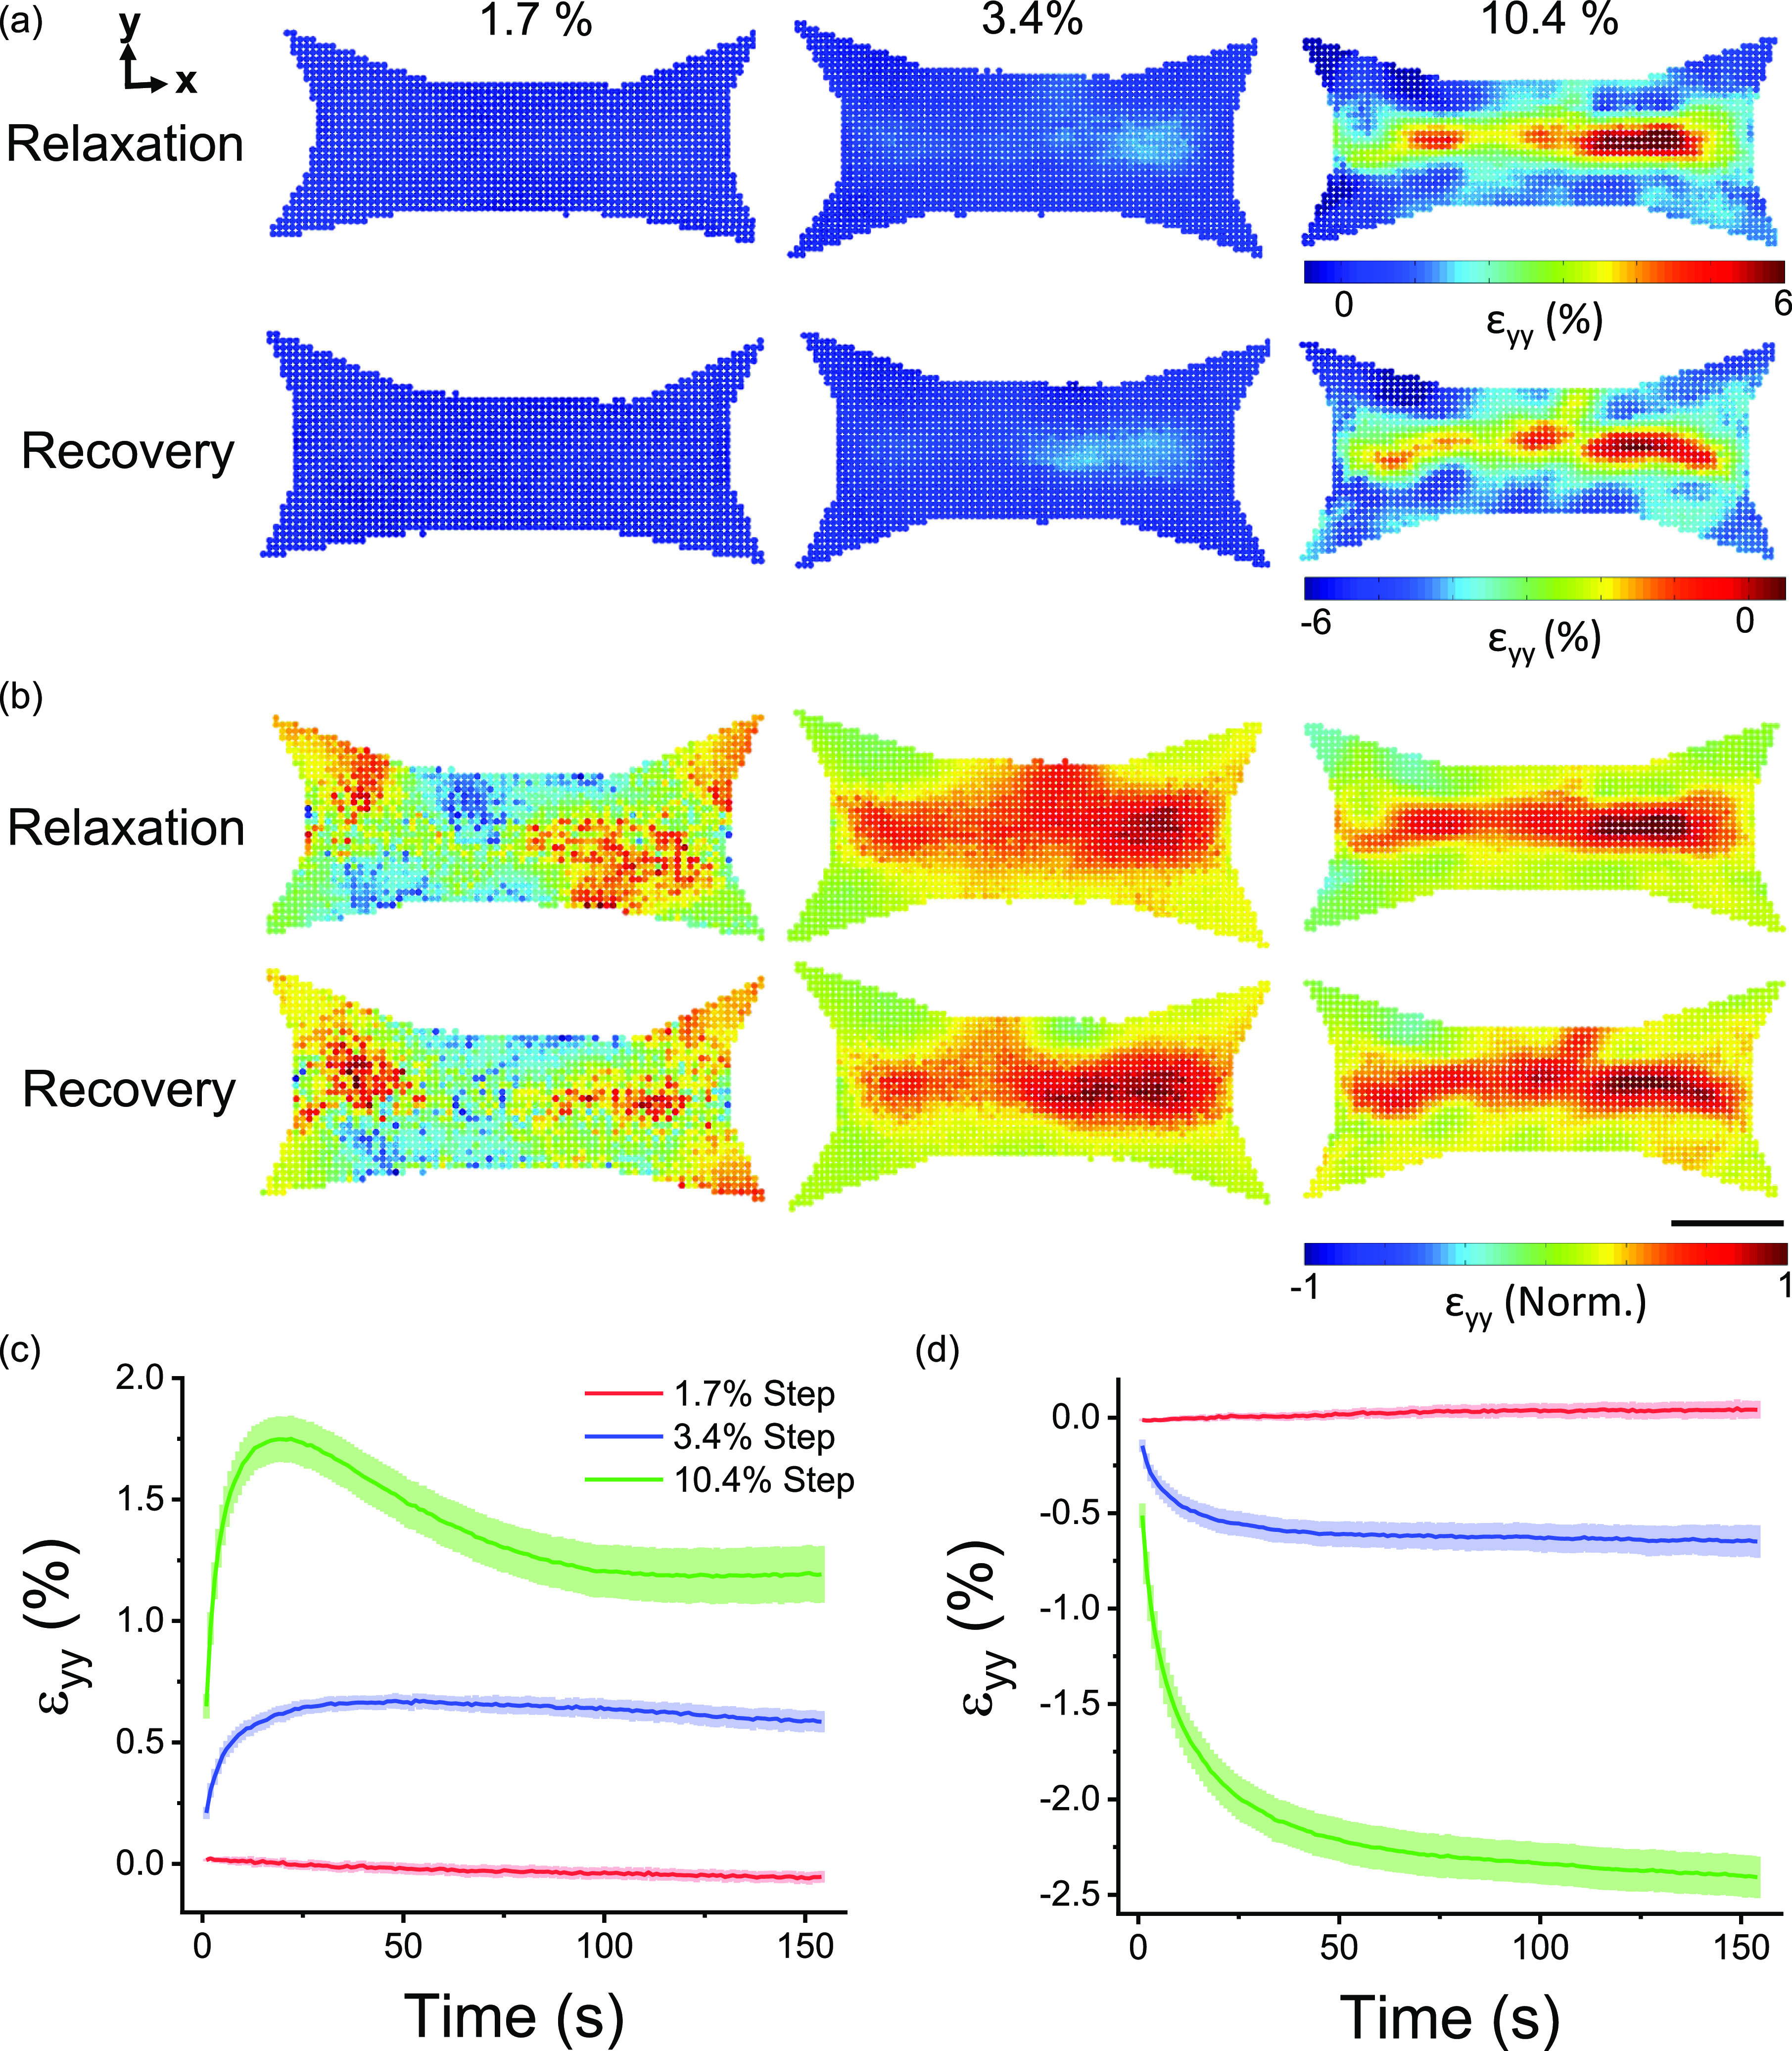
The locations of viscoelastic deformation following changes in the microtissue length were strain-dependent. Spatial distributions of relaxation and recovery in the (transverse) y-direction immediately after various step sizes are shown in (a). The distributions are normalized to three standard deviations outside of the absolute mean value in (b). The scale bar represents 100 μm. The average (N = 6) strain in the transverse direction that occurred during stress relaxation and recovery is plotted against elapsed time in (c) and (d), respectively.