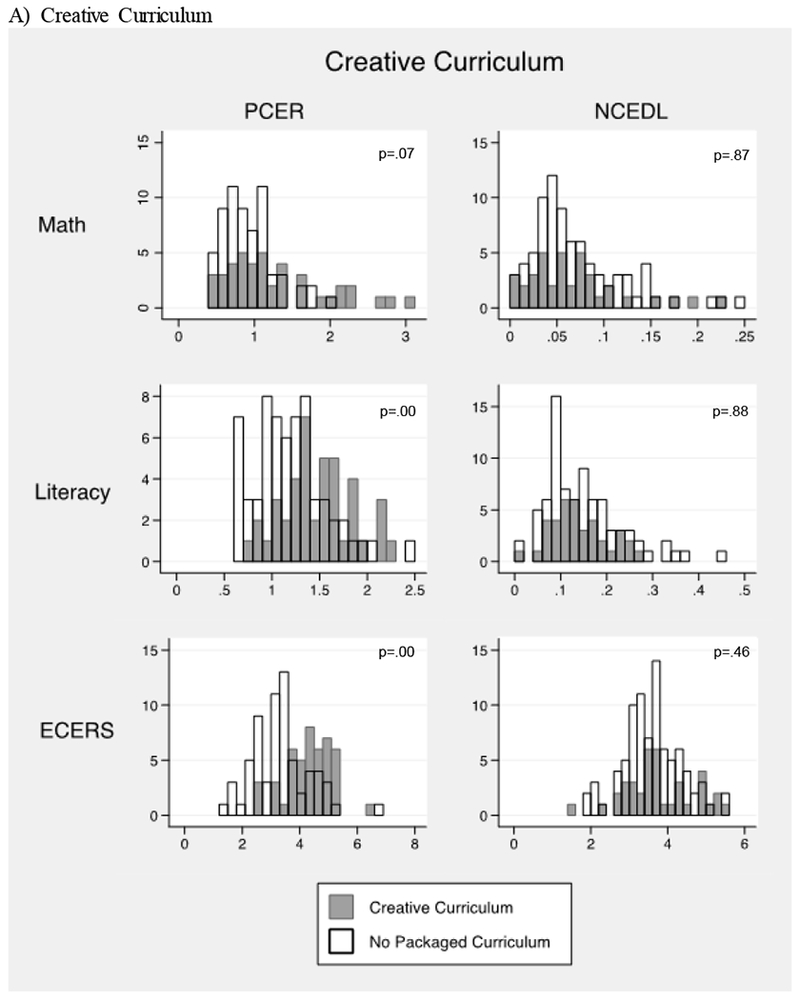
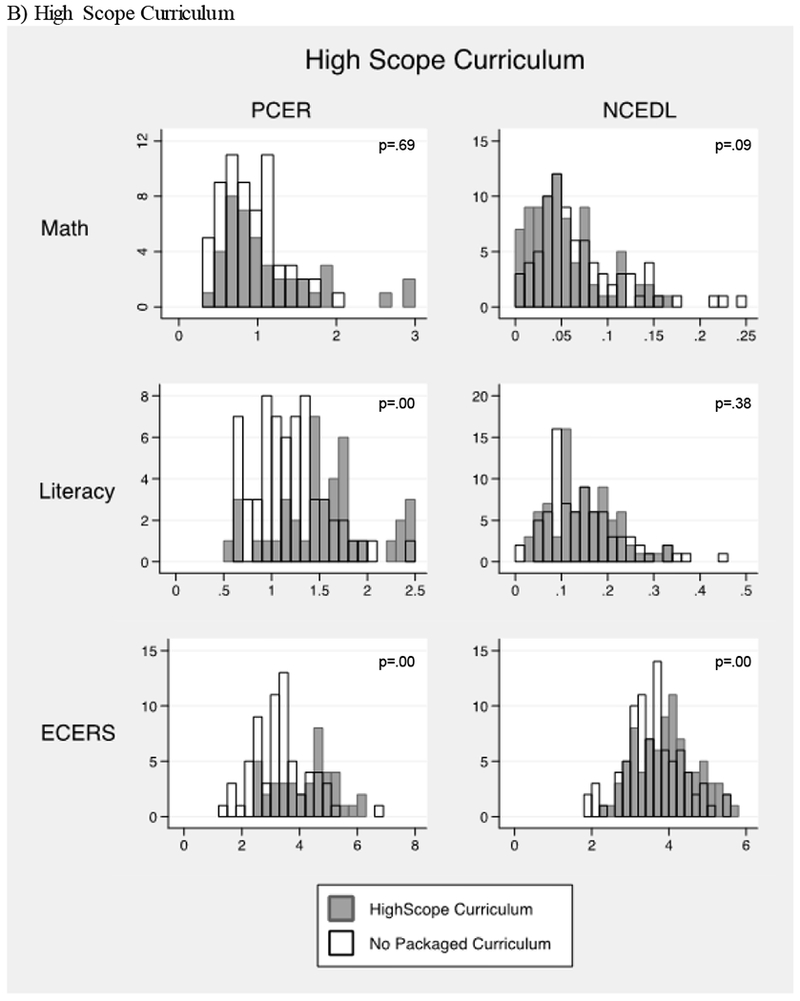
Figure 1:


Histograms of Classroom Quality and Classroom Activities in Creative Curriculum and High Scope Classrooms in the PCER and NCEDL Studies
Note: Bins are comprised of classroom-level observations. ECERS, Math, and Literacy activities measures are in raw scale form (X-axis labels are omitted). ECERS scale ranges from 0-7, Math and literacy activities are shown as proportion of day in NCEDL (EAS Snapshot), and from a 0-3 scale in PCER (TBRS). P-values from Kolmogorov-Smirnov tests for the equality of the classroom distributions between the focal curriculum (Creative Curriculum or HighScope) and No Packaged (published) Curriculum classrooms are displayed in each graph, where p <.05 indicates significantly different distributions of the classroom measure between the two groups. See text for more detail.
