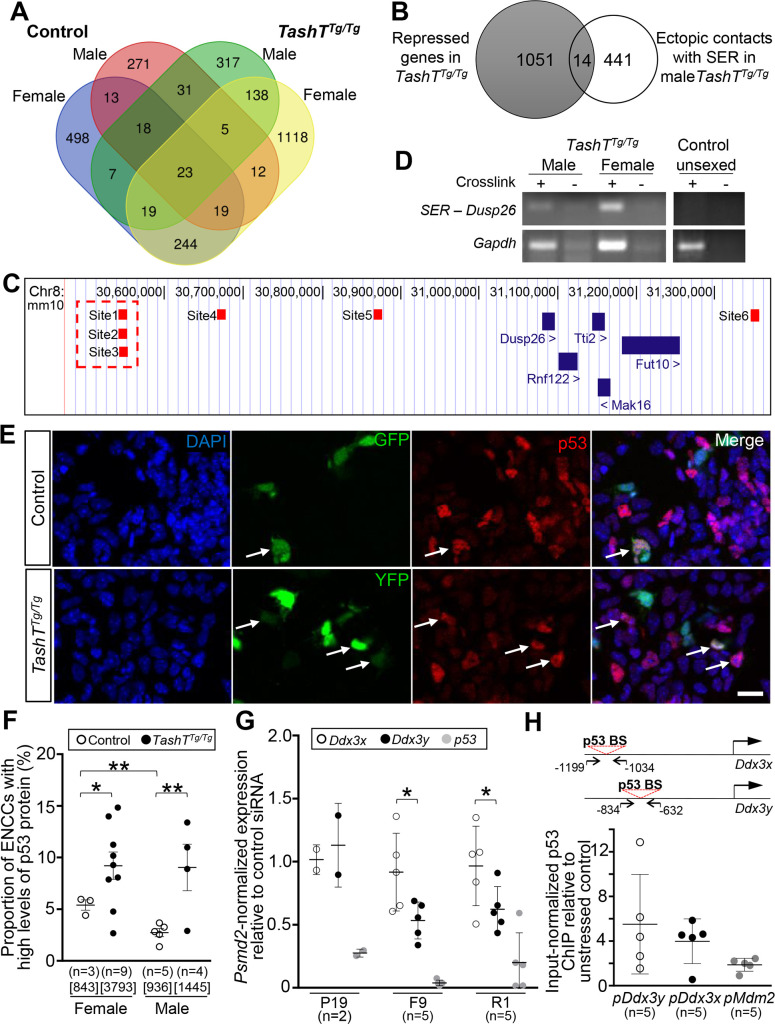
Fig 4. Ddx3y upregulation may be explained by increased activity of p53 in TashTTg/Tg ENCCs.
(A) Venn diagram displaying all genes associated with the regions captured in the 4C-seq analysis (see Fig 3A). Shared and unique interactions are shown as a function of genotype (Gata4p-GFP control vs TashTTg/Tg) and sex (female vs male). The name of every involved gene is provided in S4 Dataset. (B) Venn diagram comparing the 1065 genes previously identified as being repressed in unsexed TashTTg/Tg ENCCs (S2 Dataset) with the 455 genes identified in the 4C-seq analysis as interacting with the Hace1-Grik2 silencer-enriched region in male TashTTg/Tg ENCCs (317 in males only, and 138 in males and females). The 14 genes common to both sets, including the p53 phosphatase-coding gene Dusp26, are listed in Table 2. (C) Genomic position of all sequences (small red boxes, named Site1 to 6) from the Dusp26 locus that were captured by 4C-seq (Diagram adapted from the UCSC genome browser; genome.ucsc.edu). The Site1-3 region (highlighted by a red dashed outline) was used as target sequence in the 3C-PCR experiment shown in D. (D) Representative 3C-PCR results showing inter-chromosomic interaction between the Hace1-Grik2 silencer-enriched region and the Dusp26 locus. 3C libraries (n = 3 for each condition) were made from whole e12.5 embryonic intestines dissected from sexed TashTTg/Tg embryos and unsexed Gata4p-GFP control embryos. Intra-chromosomic interaction at the Gapdh locus was used as library positive control, and non-crosslinked (-) cells were used as background control. (E) Representative confocal images of male e12.5 intestinal cells freshly dissociated from Gata4p-GFP control and TashTTg/Tg embryos, and immunolabeled for p53 (red). ENCCs are endogenously labeled with either GFP (in control) or YFP (in TashTTg/Tg), and those showing high levels of p53 are identified by white arrows. Scale bar, 20μm. (F) Sex-stratified quantitative analysis of ENCCs with high levels of p53 protein using images such as those displayed in E. The total number of counted cells is indicated in brackets. (G) RT-qPCR analysis of endogenous mRNA expression of Ddx3x, Ddx3y and p53 following siRNA-mediated p53 knockdown (relative to control siRNA) in P19, F9 and R1 embryonic cell lines. (H) ChIP-qPCR assays in R1 embryonic stem cells showing transfection stress-induced enrichment of p53 binding on Ddx3y, Ddx3x and Mdm2 promoters. Relative position of the primers used to amplify Ddx3x and Ddx3y promoter sequences that contain a p53 binding site are shown at the top. (* P≤0.05; ** P≤0.01; Student’s t-test).

