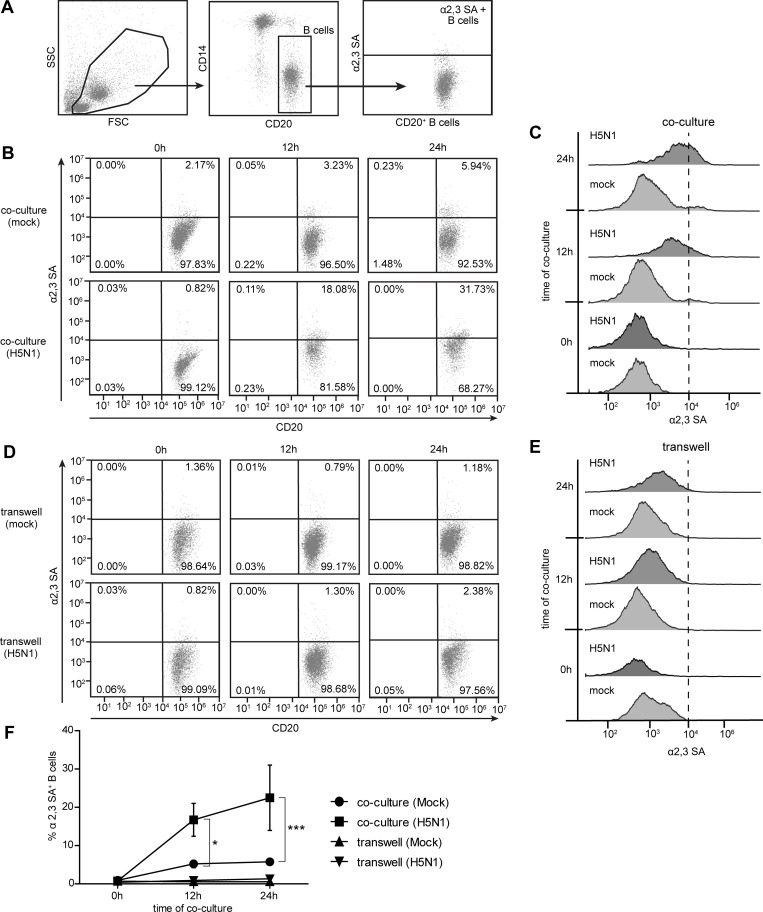
Fig 2. H5N1 virus and cell-cell contact are required for increased expression of α2,3 SA on B cells.
H5N1 infected monocytes and B cells were co-cultured or indirect cultured in a transwell for 0, 12 and 24 hours. Mock infection controls were performed in parallel. The cells were then harvested, and CD20 (B cell marker) and α2,3 SA staining was performed, and the cells were analyzed by flow cytometry. (A) CD20+ B cells were gated to identify α2,3 SA expression. The kinetics of α2,3 SA expression on B cells in direct co-cultures and transwells are shown in (B) and (D), respectively, (Mock infection, upper panel; H5N1 infection, lower panel). The MFI histograms of α2,3 SA expression on B cells are demonstrated in (C) and (E). Percentages of α2,3 SA+ B cells are summarized in (F). The data represent as mean ± SEM from three independent experiments (three donors). Statistical analysis was performed using two-way ANOVA. *P < 0.05, ***P < 0.001.

