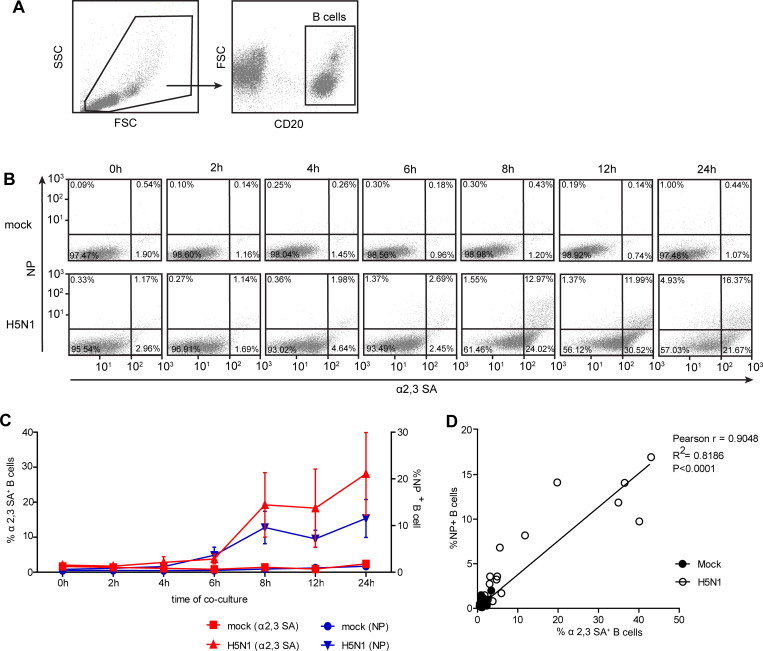
Fig 5. The acquisition of α2,3 SA on B cell surfaces by trogocytosis is associated with enhanced susceptibility to H5N1 infection.
B cells and monocytes were co-cultured with/without H5N1 infection for 0, 2, 4, 6, 8, 12, and 24 hours. CD20, α2,3 SA and influenza viral NP staining was performed, and the cells were analyzed by flow cytometry. (A) CD20+ B cells were gated to identify α2,3 SA and NP expression. (B) α2,3 SA and NP expression on B cells in H5N1 infected and mock are shown (Mock infection, upper panel; H5N1 infection, lower panel). Percentages of α2,3 SA+ (left Y-axis) and NP+ B cells (right Y-axis) are summarized in (C) (mean ± SEM; n = 3). (D) The correlation (Pearson correlation) between α2 SA+ and NP+ on B cells is shown. The line represents to the linear regression results; Pearson r correlation coefficient, R2 coefficient of determination and p-value are shown in the right top.

