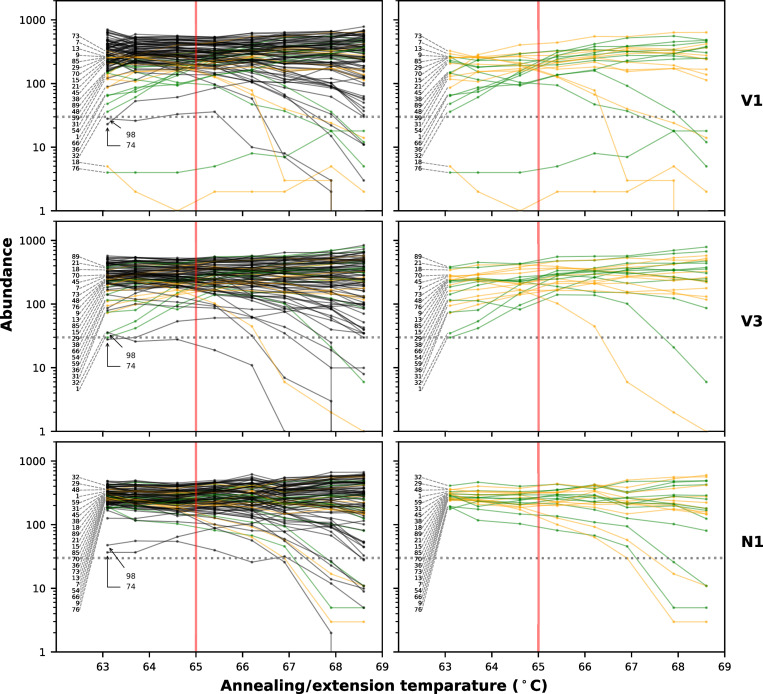
Fig 3. Responses to different annealing/extension temperatures.
Abundance of 98 amplicons at 8 different annealing/extension temperatures with the three different primer sets on a same clinical sample (previously deposited to GISAID with ID EPI_ISL_416584, Ct = 16, 1/300 input per reaction). For all data, reads were down-sampled to normalize average coverage to 500X before analysis. The green lines and points indicate the abundances of amplicons whose primers in V1 primer set were subjected to modification in the N1 primer set. The orange lines and points indicate the abundances of amplicons whose primers were not modified but predicted to be eliminated the adverse primer interactions in the N1 primer set. Other amplicons which were not subjected to the modification are indicated by black lines and points. The plots in the left column shows results of all 98 amplicons while only amplicons targeted by modification are shown in the plots in the right column. Horizontal dotted line indicates fragment abundance = 30. Red vertical lines indicate normal annealing/extension temperature, 65°C. All those experiments were conducted with the same PCR master mix (except primers) and in the same PCR run in the same thermal cycler.

