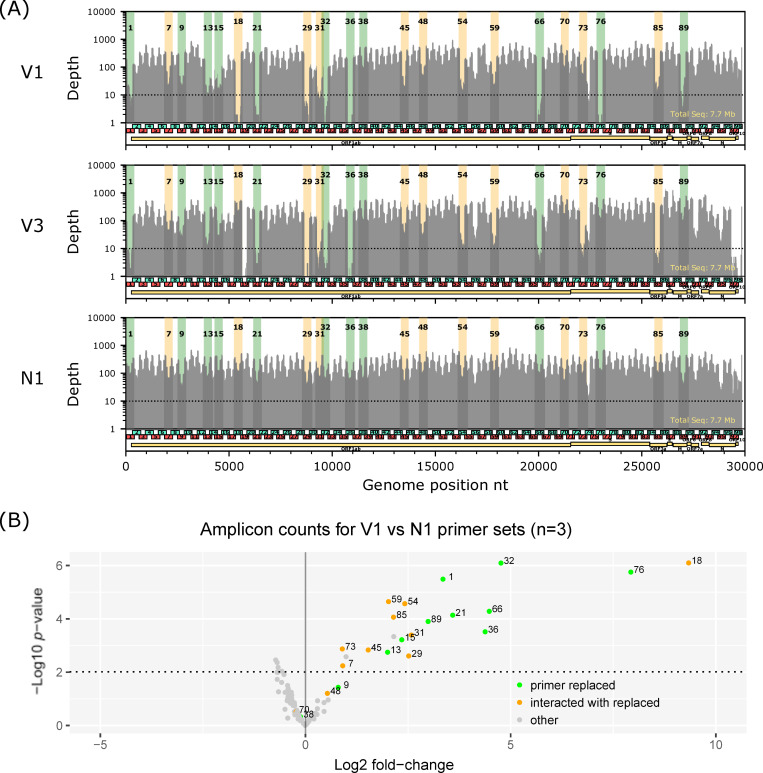
Fig 4. Performance comparison of the three multiplex PCR primer sets.
(A) A depth plot of original (V1) and two modified ARTIC primer sets (V3 and N1) on a same clinical sample (previously deposited to GISAID with ID EPI_ISL_416596, Ct = 28.5, 1/25 input per reaction). Regions covered by amplicons with modified primers and with not modified but interacting primers are highlighted by green and orange colors, respectively. For all data, the reads were down-sampled to normalize average coverage to 250X. Horizontal dotted line indicates depth = 30. These two experiments were conducted with the same PCR master mix (except primers) and in the same PCR run in the same thermal cycler. (B) Volcano plot for coverages of all 98 amplicons in PCR using the primer set N1 compared with PCR using the primer set V1 among three clinical samples (shown in Fig 4A and S1 Fig). Points with green color indicate amplicons whose primer(s) was subject to replacement. Points with orange color indicate amplicons whose primers were not replaced but had been predicted to interact with either of the replaced primers as shown in Fig 2A.

