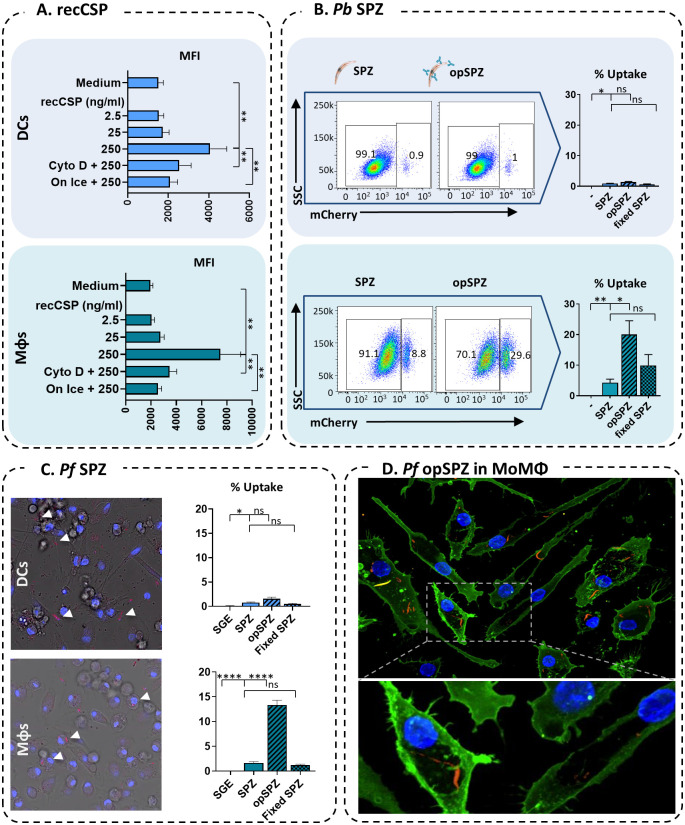
Fig 2. Uptake of recCSP and whole SPZ by MoDCs and MoMϕs.
A. Quantification of fluorescent recCSP uptake (ng/ml) in MoDCs (top) and MoMϕs (bottom); MFI: median fluorescence intensity. N = 2, 4 donors. B. Uptake of whole Pb sporozoites by MoDCs and MoMϕs. Representative flow cytometry plots showing mCherry expression in MoDCs (top) and MoMϕs (bottom) after stimulation with SPZ or opsonized SPZ using an anti-CSP antibody (opSPZ). Quantification of SPZ uptake (% of mCherry+ APCs) by flow cytometry. N = 3, 9 donors (fixed SPZ: 4 donors). C. Uptake of whole Pf sporozoites by MoDCs and MoMϕs quantified by confocal microscopy. N = 2, 4 donors, on average 1150 MoMacs and 550 MoDCs per donor per condition. D. Confocal microscopy image of Pf SPZ uptake by MoMϕs.

