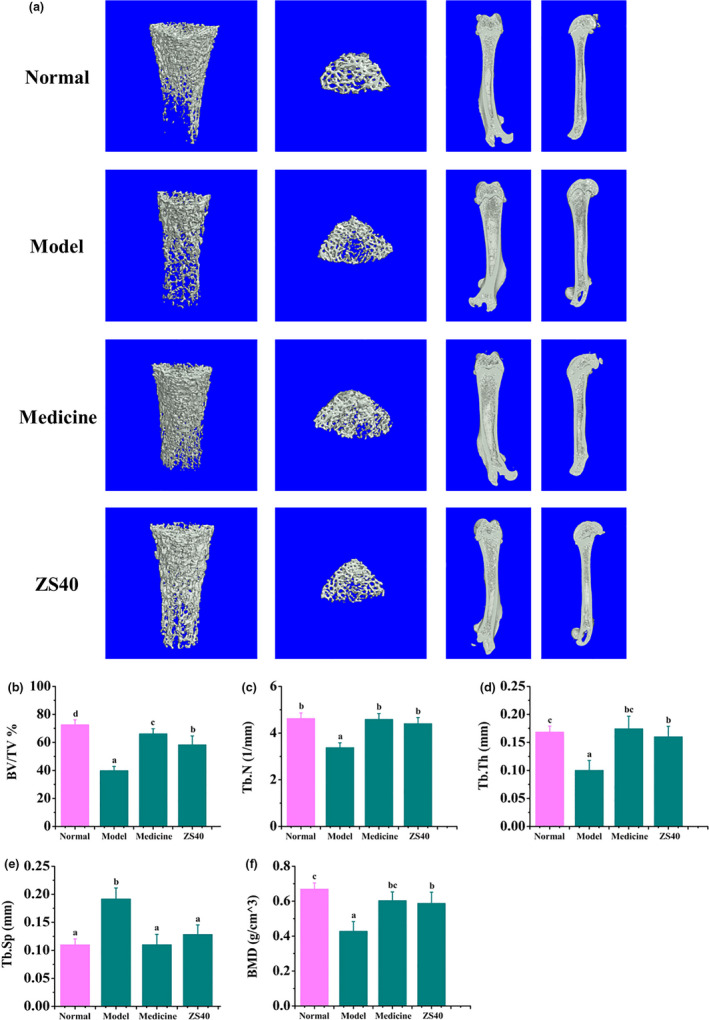
FIGURE 3.

Micro‐CT results of rats' femur. Different letters over the bars within each panel indicate significant difference between the groups (p < .05). (a) All images are representative of the respective groups (n = 6). (b) Percent bone volume (BV/TV). (c) Trabecular number (Tb.N). (d) Trabecular thickness (Tb.Th). (e) Trabecular separation (Tb.Sp). (f) Bone mineral density (BMD)
