
Figure 2.
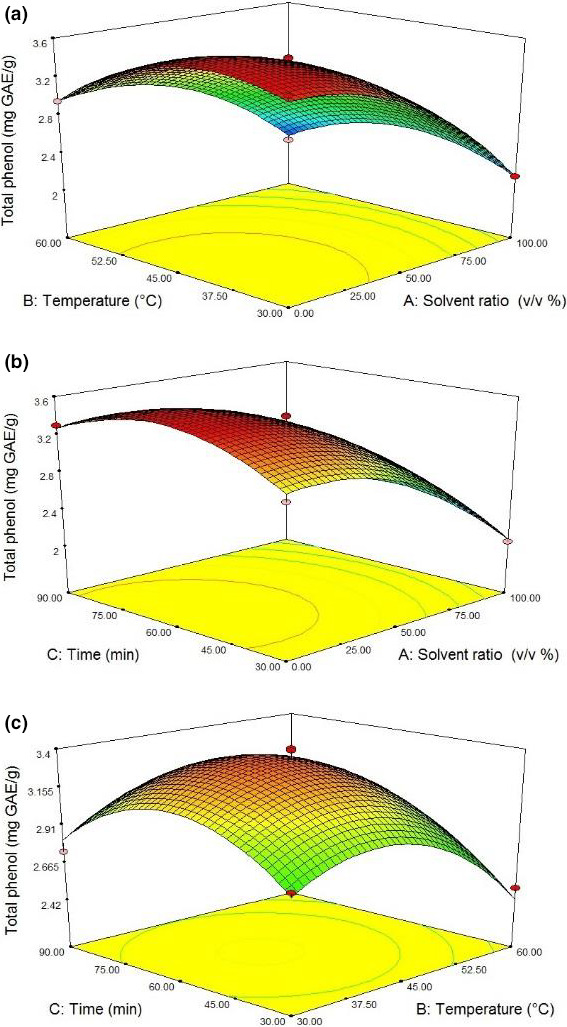
Response surface plots of total phenol (mg GAE/g) at interaction factors of (a) solvent ratio and temperature, (b) solvent ratio and time, and (c) temperature and time
Official websites use .gov
A
.gov website belongs to an official
government organization in the United States.
Secure .gov websites use HTTPS
A lock (
) or https:// means you've safely
connected to the .gov website. Share sensitive
information only on official, secure websites.
Response surface plots of total phenol (mg GAE/g) at interaction factors of (a) solvent ratio and temperature, (b) solvent ratio and time, and (c) temperature and time