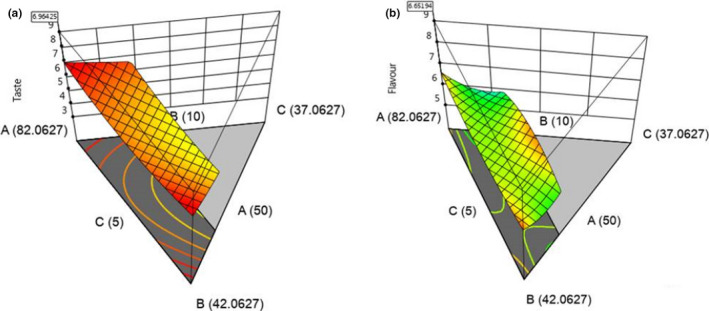
FIGURE 2.

Response surface curves for the effect of ingredient proportions on (a) taste and (b) flavor changes in bean‐based composite extruded snacks and their optimal values. A, beans; B, maize; and C, OFSP; where amaranth was kept constant at 2.94 g/100 g of total ingredients
