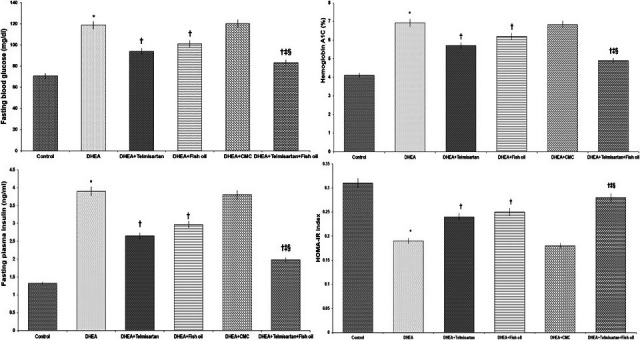
FIGURE 1.

Effect of different treatments on fasting blood glucose (FBG), HbA1c, fasting plasma insulin, and HOMA‐IR index. *Significant compared to the control group (p‐value <.05); †Significant compared to DHEA group (p‐value <.05); ‡Significant compared to DHEA + Telmisartan group (p‐value <.05); and §Significant compared to DHEA + Fish oil group (p‐value <.05)
