
FIGURE 3.
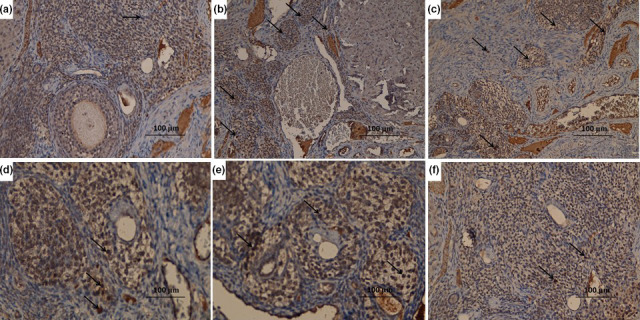
Immunohistochemical staining of NF‐κB (p65) (x400) in the ovarian tissues of (a) control group showing negative staining for NF‐κB (p65); (b) DHEA group showing strong positive staining for NF‐κB (p65) (arrow); (c) DHEA + CMC group showing strong positive staining for NF‐κB (p65) (arrow), (d) DHEA + Telmisartan group showing moderate positive staining for NF‐κB (p65) (arrow); (e) DHEA + Fish oil group showing moderate positive staining for NF‐κB (p65) (arrow); and (f) DHEA + Telmisartan +Fish oil group showing mild positive staining for NF‐κB (p65) (arrow)