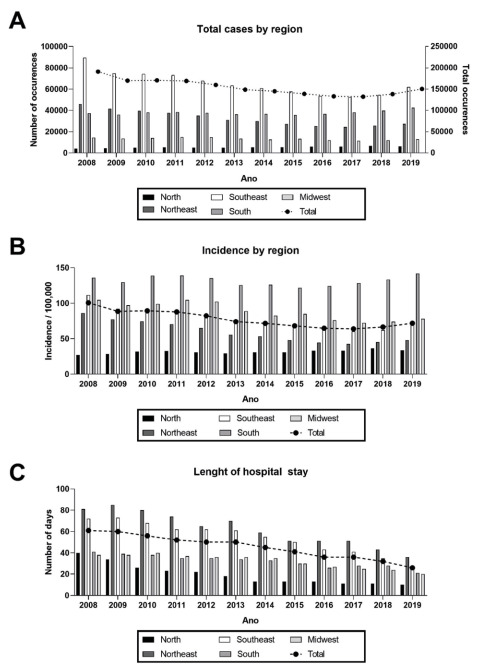
Figure 1. Total hospital admissions due schizophrenia and common mental disorders (A), incidence (B) and length of hospital stay (C) by region and year. Data for each region is plotted in the left Y axis, while total data (all regions combined) is plotted in the right Y axis.

