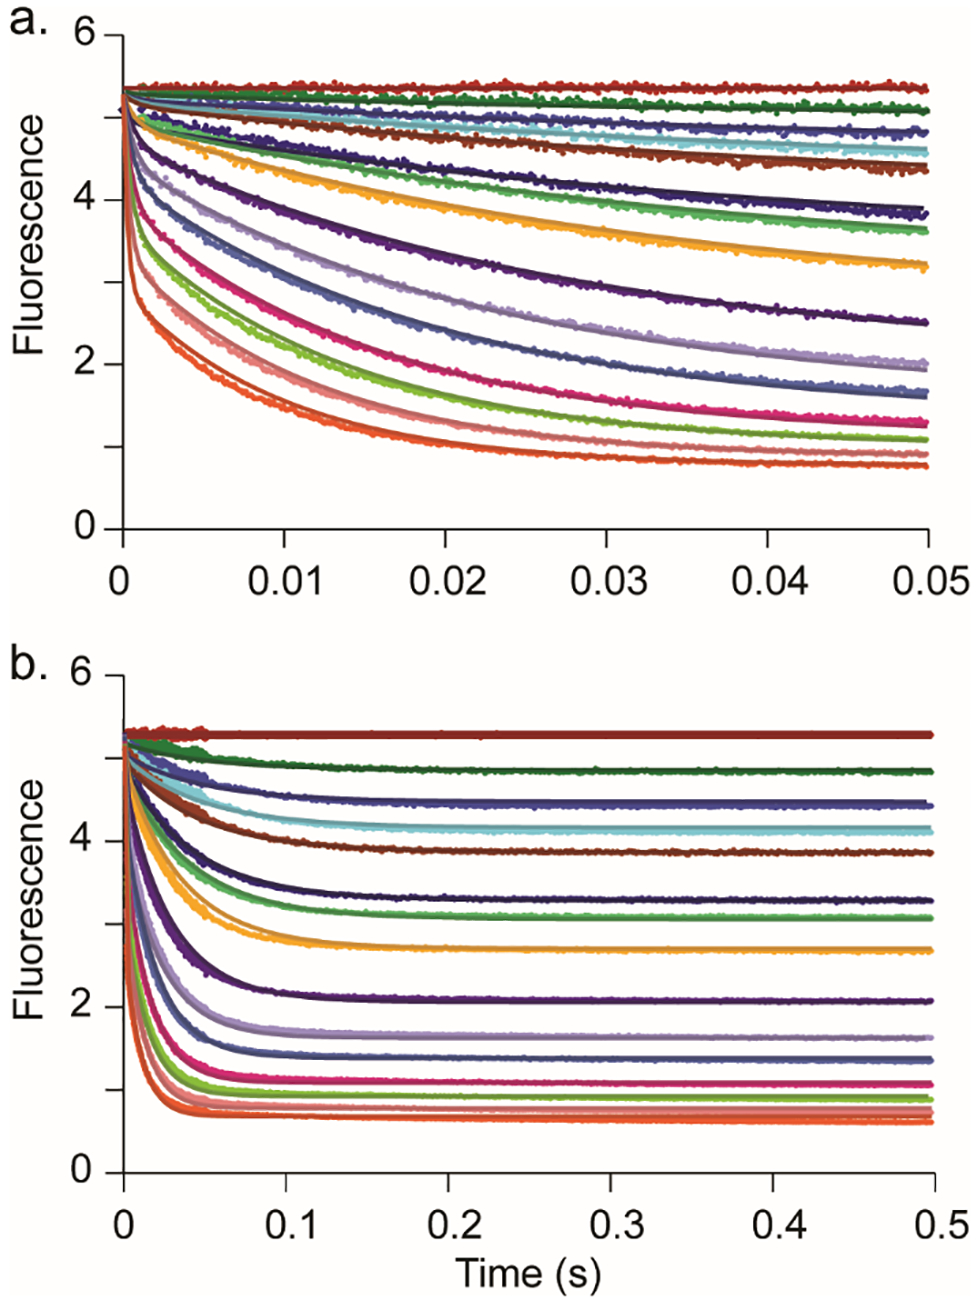
Figure 7.

Fit of stopped-flow traces by simulation. (a) Stopped-flow fluorescence traces (0.05 s) monitoring the changes in fluorescence of Cj1427 bound NADH conversion to NAD+ with various α-ketoglutarate concentrations. (b) Stopped-flow fluorescence traces (0.5 s) monitoring the changes in fluorescence of Cj1427 bound NADH conversion to NAD+ with various α-ketoglutarate concentrations. The solid lines show the simultaneous fit by simulation to the model shown in Scheme 4. The concentrations of α-ketoglutarate are 0, 2.5, 5, 7.5, 10, 15, 20, 30, 50, 75, 100, 150, 200, 300, 500 μM. Data were collected using 15 μM Cj1427 (final concentration) with α-ketoglutarate in 50 mM HEPES/KCl buffer, pH 7.4. Colors are maintained in both panels.
