
Fig. 3. Scaling and transition points for sleep time ratios.
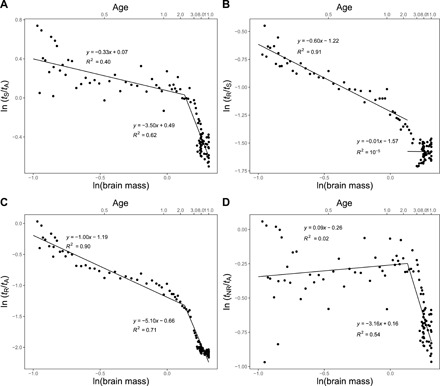
(A) Plot of the logarithm of the ratio of total sleep time to total awake time per day versus the logarithm of brain mass with measured slope of −0.33 before transition and −3.50 after. (B) Plot of the logarithm of the ratio of REM sleep time to total sleep time per day versus the logarithm of brain mass with measured slope of −0.60 before transition and −0.01 after. (C) Plot of the logarithm of the ratio of REM sleep time to total awake time per day versus the logarithm of brain mass with measured slope of −1.00 before transition and −5.10 after. (D) Plot of the logarithm of the ratio of NREM sleep time to total awake time per day versus the logarithm of brain mass with measured slope of 0.09 before transition and −3.16 after. Also, shown on the top horizontal axes is the corresponding age in years.