
Fig. 4. Active control of decay rate with voltage bias.
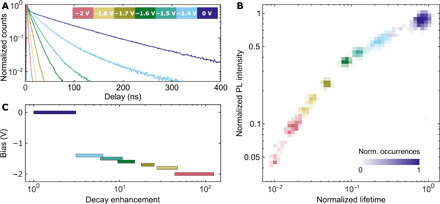
(A) The quantum dot qd1 from batch 1 was measured at different voltage biases in the electrochemical cell (the applied voltage biases are coded with colors, as shown in the inset). The overall decay histograms acquired during 60 s demonstrate a shortening of the lifetime with increasing negative bias. (B) Each of the fluorescence intensity time traces, measured at static bias, was processed as described in Fig. 2, resulting in a FLID. The intensity-lifetime pairs are represented here as a normalized distribution where the number of occurrences is measured by the level of transparency (a representative scale bar is shown for 0 V). (C) Decay rate enhancement could be controlled by applying a voltage bias. The decay rate increased rapidly for voltages below −1.4 V. The shortest decay lifetime 0.9 ± 0.2 ns was measured at −2 V for this particular quantum dot, which corresponded to an enhancement of 140 ± 30.