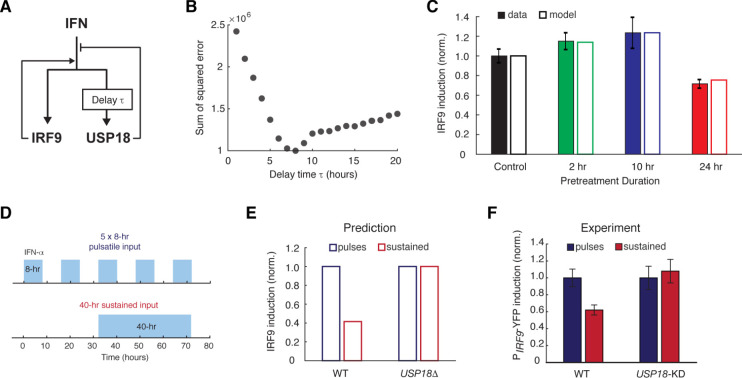
Figure 3. A kinetic model suggests a delayed negative feedback loop through USP18.
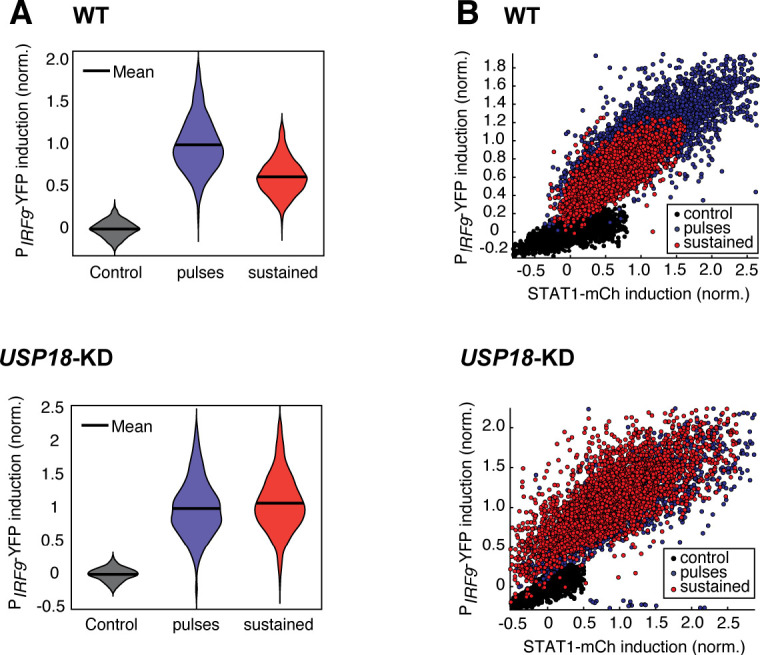
(A) A diagram for the simple kinetic model of the IFN-driven gene regulatory network. (B) Fitting errors between simulations and the data with different assigned values of the delay time in USP18 upregulation. (C) Amounts of PIRF9-YFP induction by the second IFN-α stimulation under different pretreatment conditions, from experimental data (solid bars) and model simulations with the best-fit parameters (open bars). Data were from Figure 1F and were normalized to the non-pretreatment condition (control). (D) Schematic of experimental design with repetitive IFN pulses versus a sustained IFN input. (E) Model prediction of the responses to pulsatile versus sustained IFN inputs in the presence and absence of USP18. Results were normalized to the amount of induction to the pulsatile IFN input in WT. (F) Experimental data of the responses to pulsatile versus sustained IFN inputs in WT and USP18-KD cells. The error bars represent standard deviations of single-cell data.
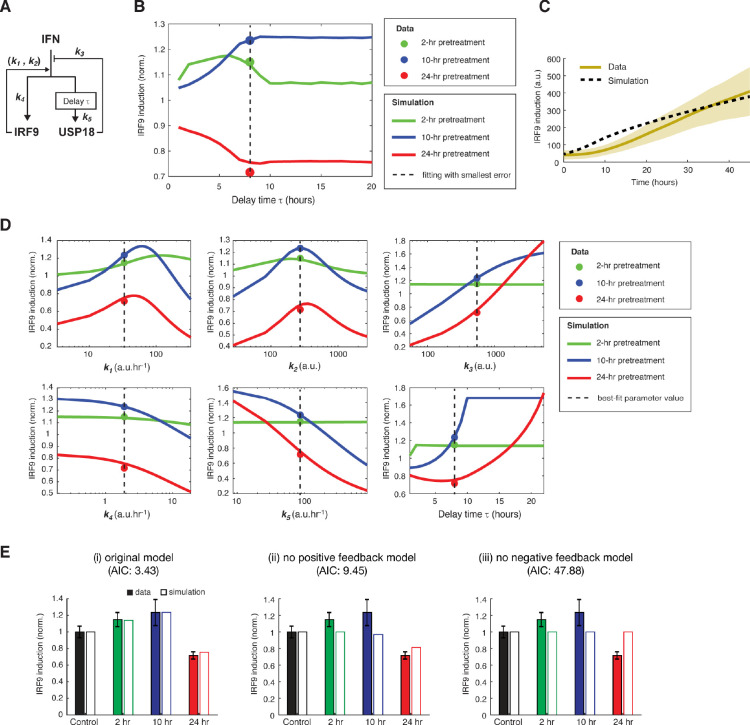
Figure 3—figure supplement 1. Model fitting results and the parameter analysis.
Figure 3—figure supplement 2. Pulsatile IFN-α treatment induces higher ISG expression in single cells.


