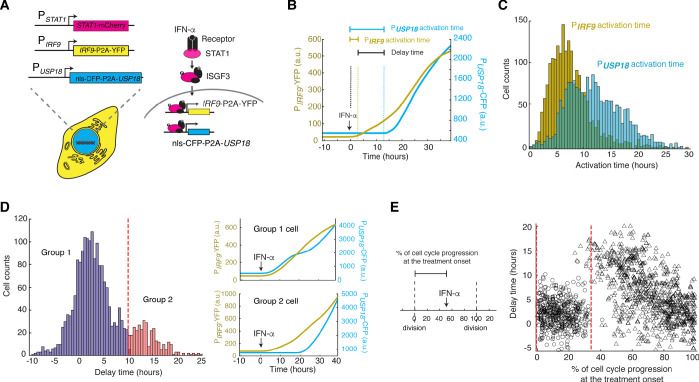
Figure 4. Heterogeneous delays in USP18 upregulation by IFN were observed in single cells.
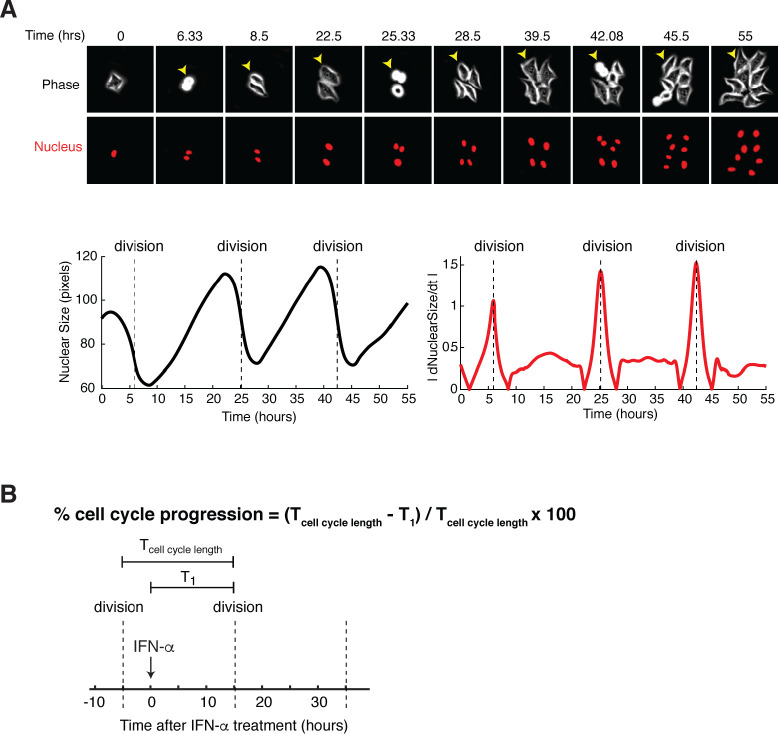
(A) Schematic of the dual reporter cell line. A coding sequence for NLS-CFP-P2A was inserted endogenously into the N-terminus of USP18 coding sequence of the previous cell line. IFN-α induces nuclear translocation of STAT1 and upregulation of IRF9 (PIRF9-YFP) and USP18 (PUSP18-CFP). (B) Representative time traces of PIRF9-YFP and PUSP18-CFP of a single cell in response to IFN-α. Activation time is defined as the time required to initiate the upregulation of the reporters after IFN-α treatment onset. Delay time is defined as the time difference between PUSP18 and PIRF9 activation times. (C) Distributions of PIRF9 and PUSP18 activation times in single cells (n = 2021 cells). The mean activation times (with 95% confidence interval) of IRF9 and USP18 are 7.9008 ± 0.1914 and 12.1620 ± 0.2349 hrs, respectively. The coefficients of variation (CVs) for activation times of IRF9 and USP18 are 0.5558 and 0.4429, respectively. (D) Distributions of delay times in single cells, quantified from the activation times in C. Cells are classified into two groups based on the delay times. Representative time traces of PIRF9 and PUSP18 in a single cell from each group are shown (right). Proportion of Group 2 cells (with a delay longer than 10 hrs) is 16.48%. (E) Single-cell delay times as a function of the percentages of cell cycle progression upon IFN treatment onset. Left: Diagram illustrating the quantification of the percentage of cell cycle progression at the treatment onset in a single cell. The time between two cell divisions (dashed lines) was considered as the length of one cell cycle. % of cell cycle progression is calculated as the ratio of the time in a cell cycle before IFN-α addition versus the full cell cycle length (100%) (See Figure 4—figure supplement 3 for details). Right: Scatterplot of delay time in each single cell versus % of cell cycle progression upon treatment onset. Open circles represent cells in which PUSP18-CFP upregulation occurred within the same cell cycle as the IFN-α addition. Open triangles represent cells in which PUSP18-CFP upregulation occurred in the next cell cycle. Red dashed lines indicate the time window for immediate PUSP18 induction. A two-sample t-test was performed for the two populations within and beyond the time window and obtained a p-value<0.001, indicating a significant difference in delay times.


