. 2020 Sep 18;9:e58825. doi: 10.7554/eLife.58825

Figure 5. USP18 expression was differentially regulated by cell cycle phases.

(A) Distributions of delay times in cells treated with different cell cycle perturbations. Cells were serum-starved or treated with lovastatin (5 μM), or with roscovitine (5 μM) for 36 hrs prior to IFN-α treatment. Proportions of Group 2 cells (with a delay longer than 10 hrs) are 16.28% (control), 4.55% (serum starvation), 2.31% (lovastatin), and 0.21% (roscovitine), respectively. (B) Schematic of CDK2 activity reporter. Amino acids 994–1087 of human DNA helicase B (DHB) was fused with mCherry. The construct was stably integrated into PUSP18 cell line using lentivirus. The dynamics of nuclear translocation of DHB-mCherry can be used to infer the cell cycle phase. Representative time-lapse images of DHB-mCherry illustrate the inference of cell cycle phases. (C) Color maps showing nuclear DHB and PUSP18-driven gene expression in the same single cells. Each row represents the time trace of a single cell. Cells were grouped into G1 (n = 104), S (n = 124) and G2 (n = 144) based on the nuclear DHB signals (left) at the time of IFN-α addition. For each group, cells were sorted based on PUSP18-CFP activation time (middle). Right: Distributions of PUSP18-CFP activation times for each group. (D) Distributions of delay times in cells treated with decitabine, a DNA methyltransferase (DMNT) inhibitor. Left: Schematic of the effect of decitabine on DNA methylation and nucleosome occupancy. Right: Distribution of delay times upon decitabine treatment. Cells were cultured with medium in the absence (control) or presence of 100 μM decitabine for 48 hrs prior to 100 ng/ml IFN-α treatment. Cells with delay times longer than 10 hrs are shown in red. Proportions of Group 2 cells (with a delay longer than 10 hrs) are 17.89% (control) and 5.92% (decitabine treated).

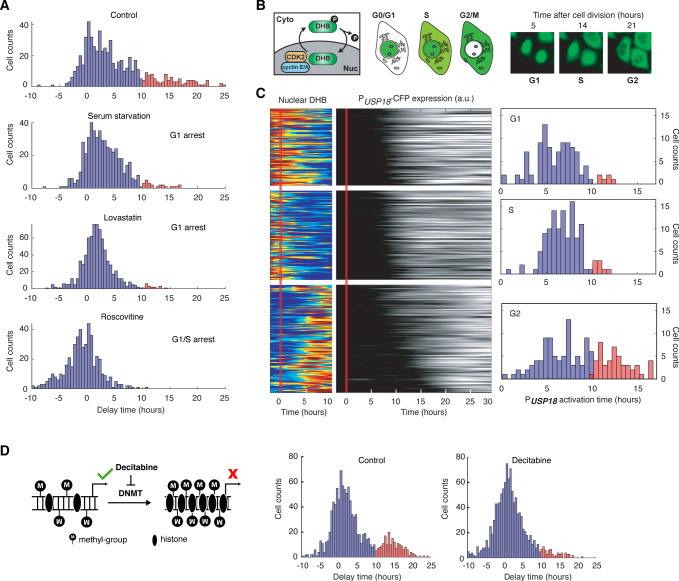
Figure 5.

Figure 5—figure supplement 1. Distributions of PIRF9 and PUSP18 activation times in cells treated with different cell cycle perturbations.

Figure 5—figure supplement 1.

Cells were serum-starved or treated with lovastatin (5 μM), or with roscovitine (5 μM) for 36 hrs prior to IFN-α treatment. The mean activation times (with 95% confidence interval) of IRF9 were 8.9482 ± 0.249 hrs (control), 8.2770 ± 0.2310 hrs (serum-starvation), 7.7281 ± 0.1588 hrs (lovastatin), and 9.8733 ± 0.3424 hrs (roscovitine), respectively. The coefficients of variance (CVs) for activation times of IRF9 were 0.3484, 0.3268, 0.2924, and 0.3868, respectively. The mean activation times (with 95% confidence interval) of USP18 were 13.7266 ± 0.4215 hrs (control), 11.4415 ± 0.3146 hrs (serum-starvation), 9.6591 ± 0.2210 hrs (lovastatin), and 8.7585 ± 0.2450 hrs (roscovitine), respectively. The CVs for activation times of USP18 were 0.3844, 0.3220, 0.3257, and 0.3121, respectively. For serum starvation, the mean IRF9 activation time was decreased by 0.67 hr (−7.5%) and the mean USP18 activation time was decreased by 2.29 hrs (−16.6%); For lovastatin, the mean IRF9 activation time was decreased by 1.22 hrs (−13.6%) and the mean USP18 activation time was decreased by 4.07 hrs (−29.6%); For roscovitine, the mean IRF9 activation time was increased by 0.93 hr (+10.3%) and the mean USP18 activation time was decreased by 4.97 hrs (−36.2%). For serum starvation and lovastatin, while both IRF9 and USP18 activation times were decreased, USP18 activation times were decreased to greater extents, resulting in shorter delay times. For roscovitine, IRF9 activation time was increased and USP18 activation time was decreased, both of which contribute to the decrease in the delay time. But the change in USP18 activation time is five times more dramatic than the change in IRF9 activation time (−4.97 hrs vs +0.93 hr), in agreement with the decrease in USP18 activation time being a major contributor to the change in the delay time under this condition.
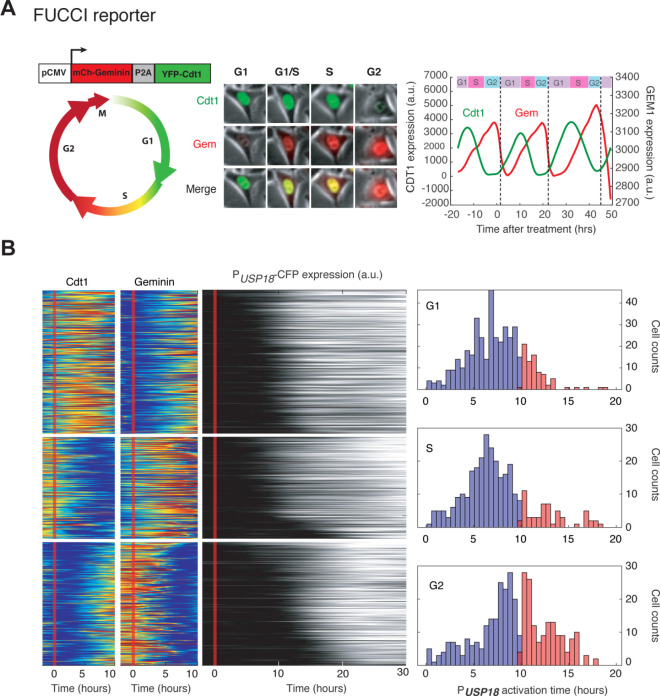
Figure 5—figure supplement 2. Cell cycle-dependent USP18 upregulation determined by the FUCCI reporter.

Figure 5—figure supplement 2.

(A) Illustration of how the FUCCI reporter works. The fluorescent signals of chromatin licensing and DNA replication factor 1(Cdt1) and Geminin (Gem) proteins oscillate throughout a cell cycle to infer cell cycle phases. Middle: Images of a representative cell showing the Cdt1 and Gem level at different cell phases. Dynamics of Cdt1 and Gem signals in a single cell are shown along with the cell cycle phase inference. Dashed lines represent cell divisions. (B) Color maps of Cdt1, Gem and PUSP18-CFP expression in the same single cells. Each row represents the time trace of a single cell. Cells were grouped into G1 (n = 451), S (n = 388) and G2 (n = 325) based on Cdt1 and Gem signals (left) at the time of IFN-α addition. For each group, cells were sorted based on PUSP18-CFP activation time (middle). Right: Distributions of PUSP18-CFP activation times for each group.
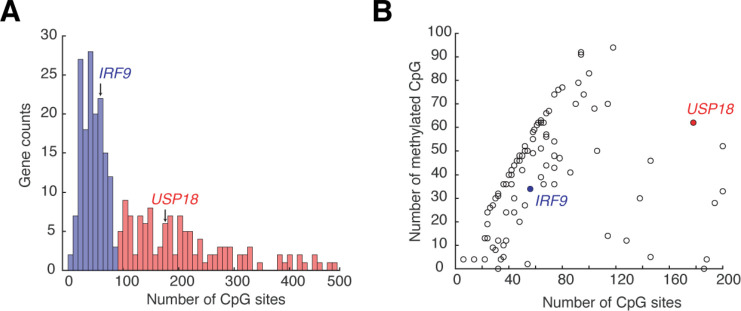
Figure 5—figure supplement 3. ISG promoters contain a wide range of CpG site numbers and methylation levels.

Figure 5—figure supplement 3.

(A) Histogram showing the numbers of CpG sites at ISG promoters. The promoter region is defined as 1000 bp upstream of the transcription start site. The data are collected from ENCODE database and the list of the 278 ISGs is from Interferome Database. Blue bars: ISG promoters with less than 100 CpG sites; red bars: ISG promoters with more than 100 CpG sites. (B) Scatterplot showing the numbers of methylated CpG versus of the numbers of CpG sites for ISG promoters. A CpG site is considered methylated if the methylation level is greater than 50% according to the bisulfide sequencing. Data are from ENCODE database for HeLa cells.
Figure 5—figure supplement 4. Distributions of PIRF9 and PUSP18 activation times in cells treated with decitabine.

Figure 5—figure supplement 4.

Cells were cultured with medium in the absence (control) or presence of 100 μM decitabine for 48 hrs prior to 100 ng/ml IFN-α treatment. The mean activation times (with 95% confidence interval) of IRF9 were 9.1632 ± 0.2877 hrs (control) and 10.0063 ± 0.3244 hrs (decitabine), respectively. The coefficients of variance (CVs) for activation times of IRF9 were 0.5289 and 0.5604, respectively. The mean activation times (with 95% confidence interval) of USP18 were 13.1356 ± 0.3409 hrs (control) and 11.2538 ± 0.3071 hrs (decitabine), respectively. The CVs for activation times of USP18 were 0.4372 and 0.4718, respectively. The decitabine treatment increased the mean IRF9 activation time by 0.84 hr (+9.2%) and decreased the mean USP18 activation time by 1.88 hrs (−14.3%), both of which contribute to the decreased delay time.
Figure 5—figure supplement 5. The effect of decitabine on cell cycle.

Figure 5—figure supplement 5.

(A) Representative single-cell time traces from decitabine-treated cells. Cells were treated with 100 μM decitabine for 36 hrs prior to being imaged and kept in decitabine throughout the experiment. The FUCCI reporter dynamics (nuclear Cdt1 and Geminin) was tracked in single cells to determine their cell cycle phases and the type of cell cycle arrest. Decitabine-treated cells can be classified into three subgroups: cells with no arrest, cells in G1 arrest, and cells in G2 arrest. (B) Pie chart showing the proportions of cells with no arrest, arrested in G1, or arrested in G2 in a population of decitabine-treated cells.