. 2020 Sep 3;9:e56571. doi: 10.7554/eLife.56571

Figure 2. Mla mutants exhibit no defect in anterograde transport of GPLs.

(A) Schematic of the biological principle behind the OMV pulse chase assay. Cultures were pulsed with 32Pi, which is incorporated in de novo synthesized lipids (red outlined GPL). After synthesis, lipids are flipped across the IM and anterograde transported to the OM. Over the course of the experiment, a percentage of lipids from the OM will be shed as OMVs. Any 32P-labeled OMVs must have incorporated GPLs that underwent anterograde transport. (B) Representative TLC of supernatant GPLs. Total sample was loaded after LSC quantification. GPLs were separated in solvent system containing chloroform, methanol, and acetic acid (65:25:10, v/v/v). (C) LSC quantification of extracted GPLs. Circles represent individual replicates. Lettering above denotes significantly different clusters as determined by a one-way ANOVA.

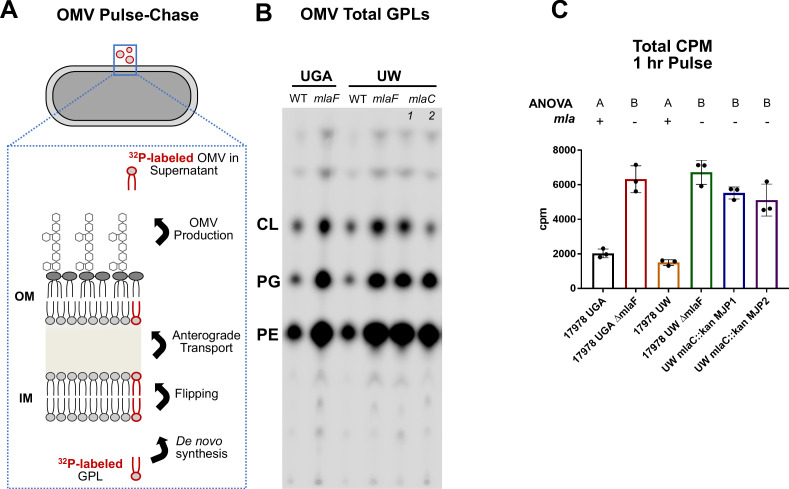
Figure 2.

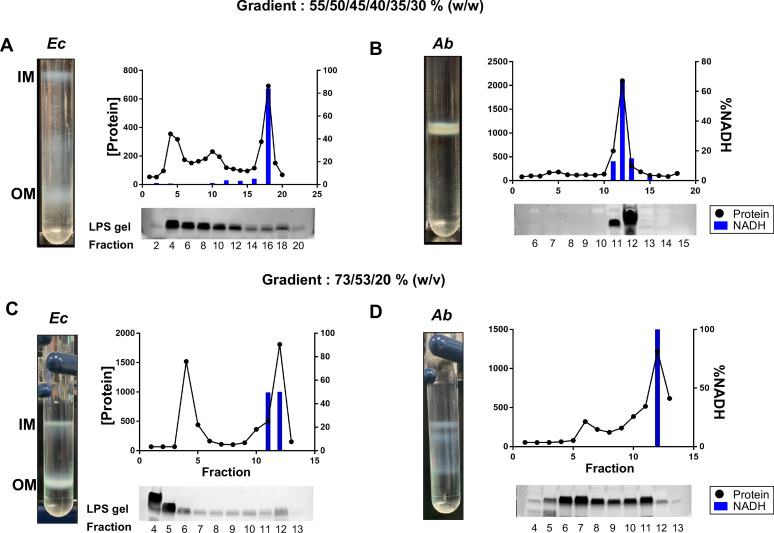
Figure 2—figure supplement 1. Membrane separations do not work in A. baumannii.

Figure 2—figure supplement 1.

(A) Left – Representative image of IM and OM separations of E. coli membranes using the protocol as designed by Osborn’s group. Right – Marker analysis. Graph displays protein content on the left y-axis with black circles and %NADH activity (IM-marker) on the right y-axis in blue bars across fractions for the entire gradient (x-axis). An SDS-PAGE gel stained for LPS (OM marker) is displayed immediately below the respective graph and numbered by fraction. (B) Left – Representative image of IM and OM separations of A. baumannii membranes using the protocol as designed by Osborn’s group. Right – Marker analysis as described above. (C) Left – Representative image of IM and OM separations of E. coli membranes using the protocol as described by the UW group. Right – Marker analysis as described above. (D) Left – Representative image of IM and OM separations of A. baumannii membranes using the protocol as described by the UW group. Right – Marker analysis as described above.
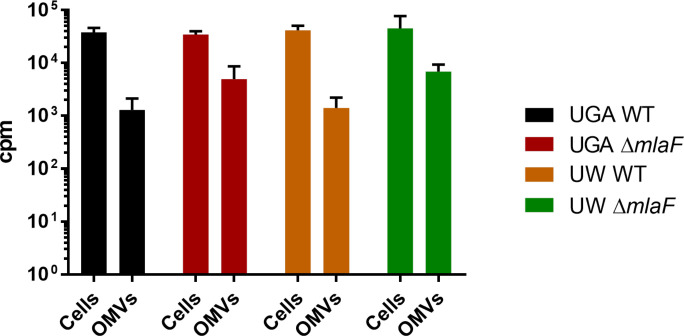
Figure 2—figure supplement 2. Liquid scintillation counts of whole cells and OMVs from pulse-chase assay.

Figure 2—figure supplement 2.

After pulse-chase, total GPLs were isolated from cell pellets in addition to the isolation of OMVs for the assay. GPLs isolated in this manner were counted by liquid scintillation counting.