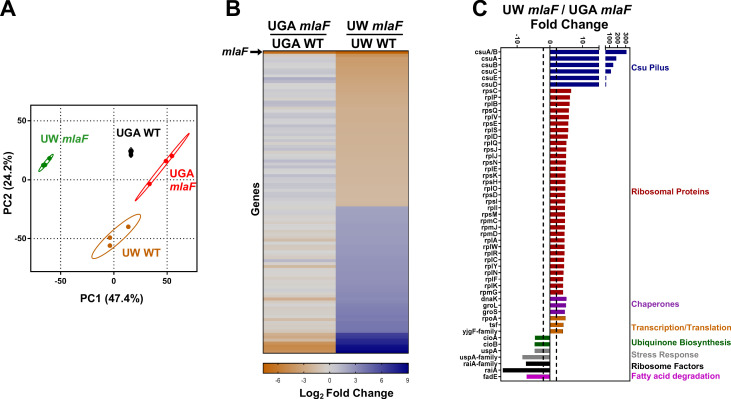
Figure 4. Transcriptomic profiling highlights substantial differences between ΔmlaF mutants.
(A) Principal components analysis (PCA) of total transcriptomic profiles of UGA WT (purple square) and ΔmlaF (blue square) and UW WT (green circle) and ΔmlaF (red circle). Each point represents a biological replicate. (B) Heat map comparing differentially regulated genes between UW ΔmlaF and UW WT. All genes in the right column are differentially expressed with a > |2| log2 fold change and a FDR p-value<0.05. For comparison, fold-change values of the same set of genes for the UGA ΔmlaF vs UGA WT are displayed in the left column. The row representing mlaF is denoted with an arrow. A full list of genes, fold-changes, and p-values for both comparisons are in Supplementary files 1 and 2. (C) Comparison of total transcriptomic profiles between UW ΔmlaF and UGA ΔmlaF mutants. Genes are clustered and colored by predicted or known function. Dashed lines denote +/- 2 fold-change. All transcriptomic data are presented as average RPKM values from three biological replicates.

