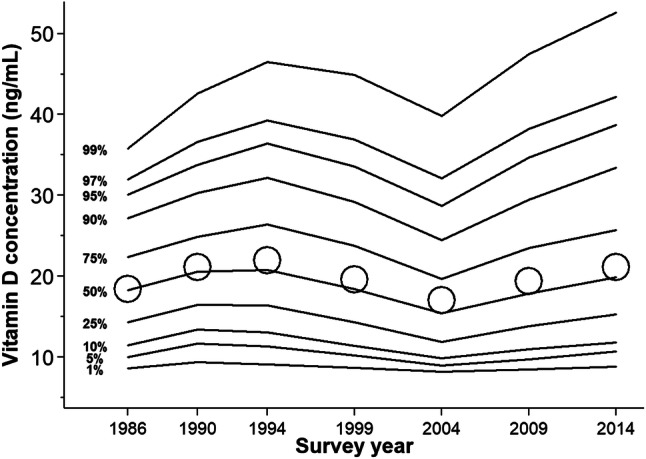
Fig. 1.

Percentile and mean distribution of vitamin D concentrations in the study population by survey year, 1986–2014. The solid lines represent percentile values, which were estimated from a quantile regression model adjusted for sex and age (continuous, years). The hollow circles represent mean values (added for comparison), which were standardized to the sex and age (< 35, 35–44, 45–54, ≥ 55 years) distribution of the entire Swedish population in 2000
