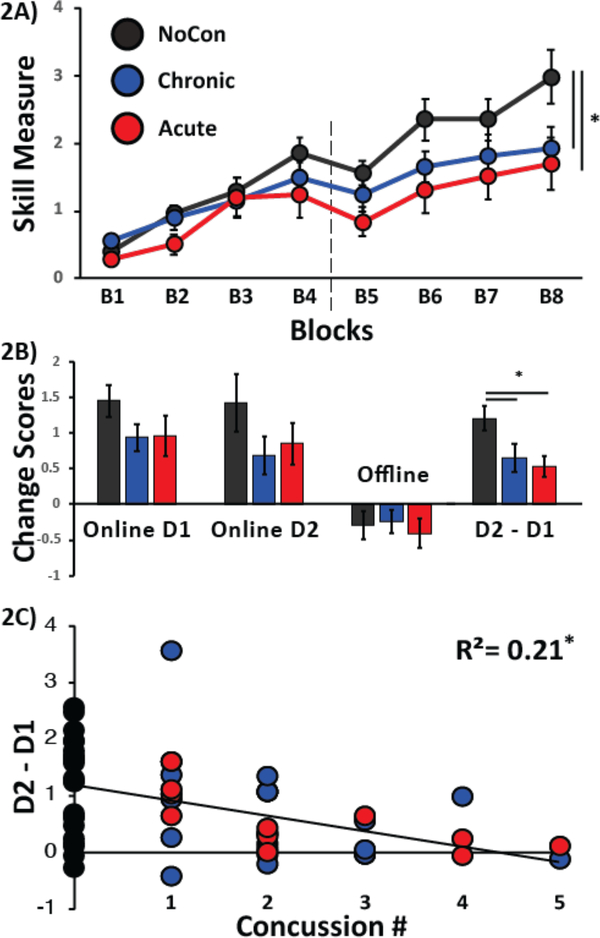
FIG 2: Performance of the SVIPT.
Black circles are the average performances of NonCon athletes, blue circles represent Chronic athletes, and red circles represent Acute athletes. Vertical dotted line denotes the separation between Day 1 and 2 of training. (A) Y-axis represents the skill measure of the SVIPT and the x-axis depicts blocks of training. Note that subjects in the NonCon group outperformed both the Chronic and Acute athletes on Day 2 of training, whereas no significant differences in performance between groups were seen for Day 1. (B) The bar graph shows group averages of the SVIPT measure on Online on D1, Online on D2, Offline between D1 and D2, and overall performance on D2 relative to D1 (D2-D1). The NonCon athletes performed significantly better than the Chronic and Acute athletes for D2-D1. (C) Correlation between Concussion History and Motor Behavior. Y-axis represents the number or prior concussions and the x-axis represents the difference in motor performance between days 2 and 1 on the SVIPT. Note that athletes with the largest number of prior concussions show the poorest performance on D2 relative to D1. Data are means ± SEM. *p≤0.05.

