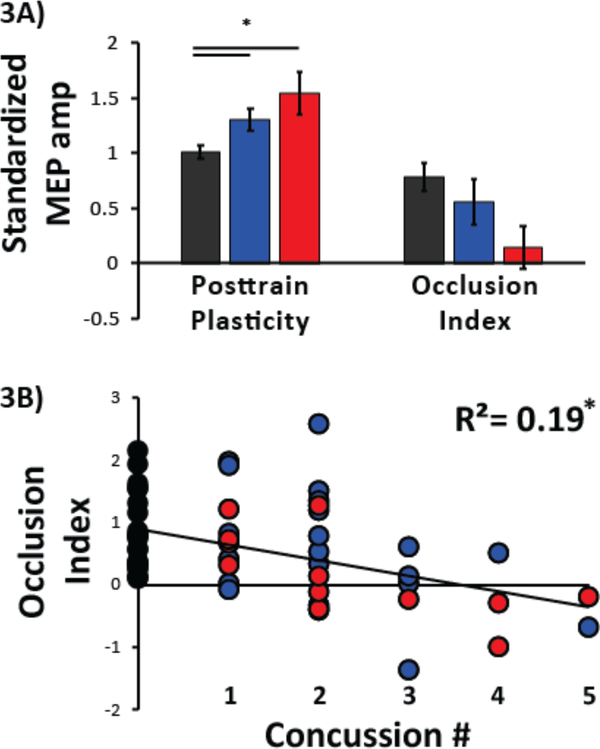
FIG 3: Neurophysiological Measures of M1.
Black represents neurophysiological responses from NonCon athletes, blue represents Chronic athletes, and red represents Acute athletes. (A) MEP amplitude ratios for pre- and post-A-tDCS. Y-axis represents the average MEP amplitude standardized to the pre-tDCS MEP amplitude and x-axis represents the two neurophysiological metrics: Occlusion and Occlusion Index. Left bar graph depicts average MEP amplitude for P1-P6 following motor training for each group. Right bar graph depicts Occlusion Index for each group. Subjects who with no history of concussion had a larger magnitude of occlusion than athletes in either the Chronic or Acute state of injury. Data are means ± SEM. *p≤0.05. (B) Correlation between Concussion History and Occlusion Index. Y-axis represents number or prior concussions and x-axis the Occlusion Index. Circles represent individual subject data and its color the group affiliation. Note that athletes with the largest number of prior concussions show the smallest magnitude in the Occlusion Index.

