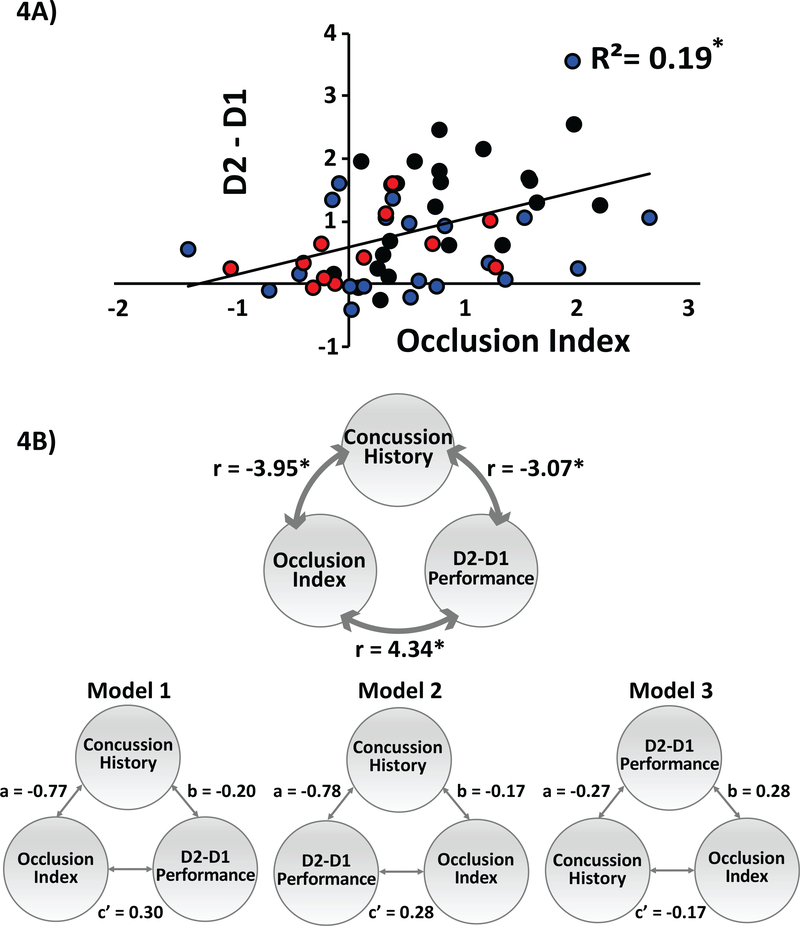
FIG 4: Relationship between motor behavior and neurophysiology of M1.
(A) Correlation between the Occlusion Index and motor behavior. Y-axis represents average skill measure on D2 minus D1 and x-axis represents the Occlusion Index (OI). Black circles represent athletes with no history of concussion (NonCon), blue circles represent athletes in the Chronic of injury, and red circles represent athletes in the Acute state of injury. Note that subjects who had the largest OI following training of SVIPT had the highest and performance D2 relative to D1. (B). Mediation analysis. Top panel: The 3 variables assessed using mediation analysis: concussion history, occlusion index, and D2-D1 motor performance. The numbers next to the double headed arrows are coefficients of correlations between the variables. Regression analyses established correlations between athletes’ concussion history, occlusion index, and D2-D1 motor performance. Bottom panel: Model 1 and 2 illustrate two different mediation analyses with concussion number as the mediating variable. Model 3 illustrates the reverse mediation analysis used to rule out model misspecification. Models 1 and 2 were significantly mediated by prior number of concussions (whereas Model 3 did not) with Model 1 serving as the best-fitting model. *p≤0.05

