
Figure 6: Association Between Survival Hazard Ratio and TMB of anti-PD(L)1 Monotherapy.
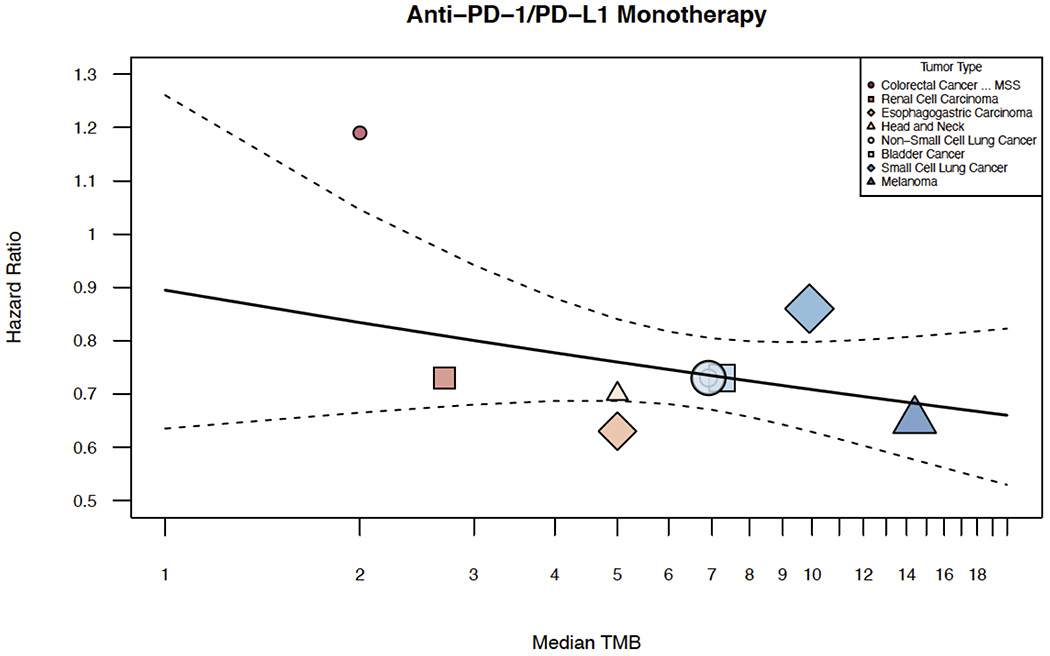
Shown above is the graphical representation of the meta-regression of survival hazards ratio and TMB. This includes the median number of coding somatic mutations per megabase (MB) of DNA in 8 tumor types or subtypes among patients who received inhibitors of PD(L)1 monotherapy for which data regarding the hazard ratio were available. A plot of hazard ratios versus median TMB was created. The meta-regression summary was graphically displayed on top of it. Inverse-variance weighting was used to vary the size of each point shape. Median TMB is shown on a log scale, but labeled on the original scale.