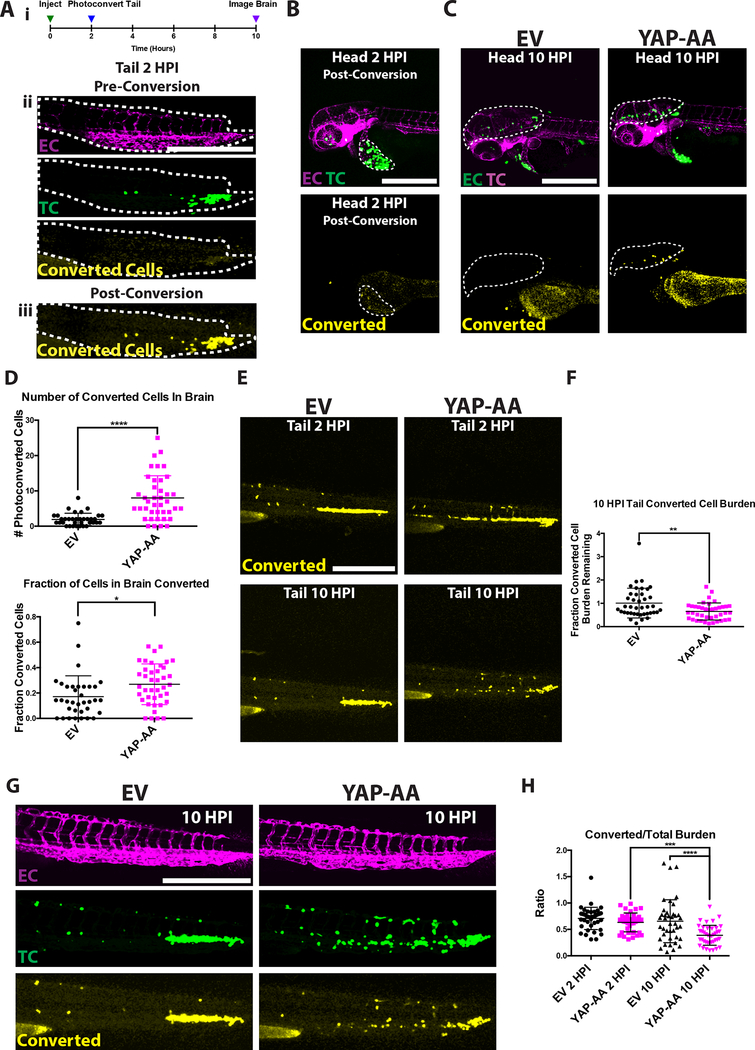
Figure 4. YAP-AA promotes tumor cell mobilization from the tail to seed the brain.
(A) (i) Experimental overview indicating that Dendra2-expressing A375 cells in the tail are photoconverted within 2 hours of injection. The brain is then imaged at 10HPI to identify photoconverted cells. (ii) A375 cells constitutively express iRFP670 (TC, green) allowing unconverted tumor cells to be identified. EC, Endothelial Cells are shown in magenta. (iii) Upon photoconversion, A375 cells exhibit converted Dendra2 fluorescence (yellow). The tail is outlined with a white dotted line. Scale bar is 500μm. (B) Image of the head at 2HPI after the cells in the tail have been photoconverted showing that cells in the head or injection site were not photoconverted. A bolus of A375 cells at the injection site is indicated with a white dotted line. Scale bar is 500μm. (C) Image of the head at 10HPI showing more photoconverted YAP-AA cells in the brain (white dotted line). Scale bar is 500μm. (D) Quantification of the number and fraction of photoconverted cells in the brain. P<0.0001 for the number of converted cells and p=0.012 for the fraction of cells that were converted. n= 35 embryos per condition across 3 independent experiments. (E) Image of photoconverted cells (yellow) in the tail at the indicated time points showing that YAP-AA cells are lost from the tail over time. (F) Quantification of the ratio of the photoconverted tumor cell burden remaining at 10HPI compared to 2HPI in the tail indicating the loss of photoconverted tumor cell burden over time. p=0.003 using a two-tailed Student’s t-test. n= 35 embryos per condition across 3 independent experiments. Scale bar is 500μm.
(G) Representative images of the tails of fli1:EGFP zebrafish embryos 10HPI showing iRFP670 (green) labeling all A375 tumor cells and converted Dendra2 (yellow) labeling tumor cells photoconverted at 2HPI. Scale bar is 500μm. Endothelial cells are labeled in magenta.
(H) Quantification of the ratio of converted tumor cell burden to total tumor cell burden of images as in F. p<0.001 for YAP2HPI->YAP 10HPI, and p<0.0001 for EV10HPI->YAP10HPI using one-way ANOVA with Tukey’s test for multiple comparisons. n=40 embryos per condition across 2 independent experiments. EC, endothelial cell. TC, tumor cell

