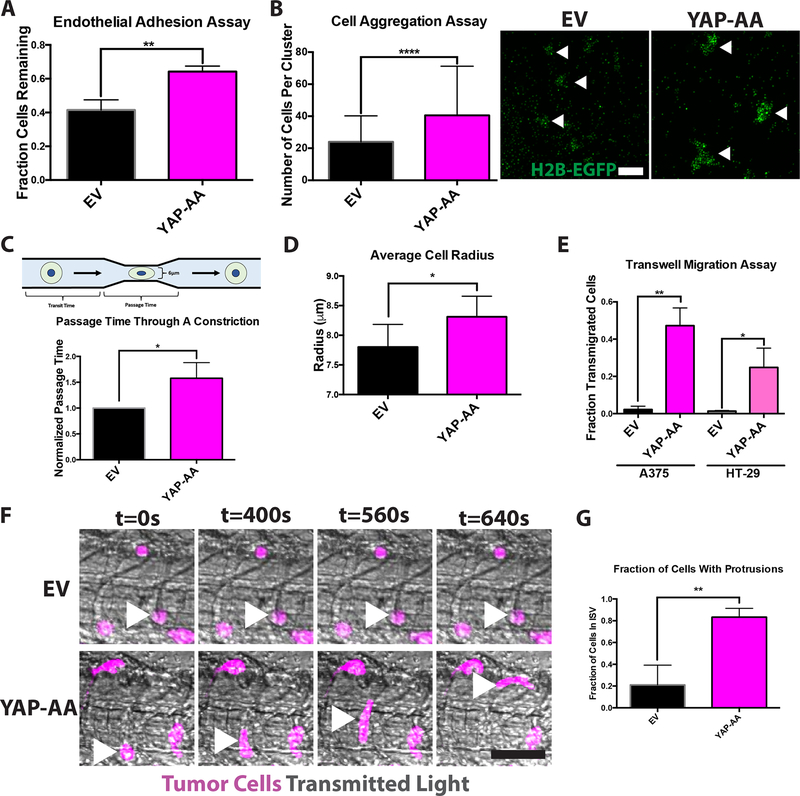
Figure 5. YAP-AA promotes intravascular migration of tumor cells.
(A) Endothelial adhesion assay indicating that YAP-AA A375 cells are more adhesive to an endothelial monolayer. p=0.004 using a two-tailed Student’s t-test on data from 3 independent experiments. (B) Cell aggregation assay indicating that YAP-over-expressing A375 cells form larger aggregates in vitro. p<0.0001 using a two-tailed Student’s t-test n=117 aggregates per condition analyzed from two independent experiments. Arrowheads indicate example aggregates in an image of H2B-EGFP-expressing A375 cells following aggregation. Scale bar is 100μm. (C) Passage time through a 6μm constriction. n= 3 independent experiments with at least 300 cells analyzed per condition per experiment. p=0.03 using a two-tailed Student’s t-test. (D) Average cell radius determined using a Coulter counter. n= 7 independent experiments with at least 3000 cells per condition per experiment. p=0.02 using a two-tailed Student’s t-test. (E) Transwell migration assays for A375 and HT-29 cells indicating that YAP-AA promotes cell migration in vitro. A375, p=0.0013 HT-29 p=0.017. Statistics were calculated using a two-tailed Student’s t-test on the averages of 3 independent experiments for each cell line. (F) Single frames from high-speed imaging of tumor cells in the tail 3 hours post-injection. Arrowheads indicate tumor cells of interest. Scale bar is 50μm. (G) Quantification of the fraction of tumor cells in the intersegmental vessels (ISVs) of the tail with protrusions that were at least as long as the cell nucleus. n=32 cells (EV) and 62 cells (YAP-AA) across 3 independent experiments. p=0.006 using a two-tailed Student’s t-test.

