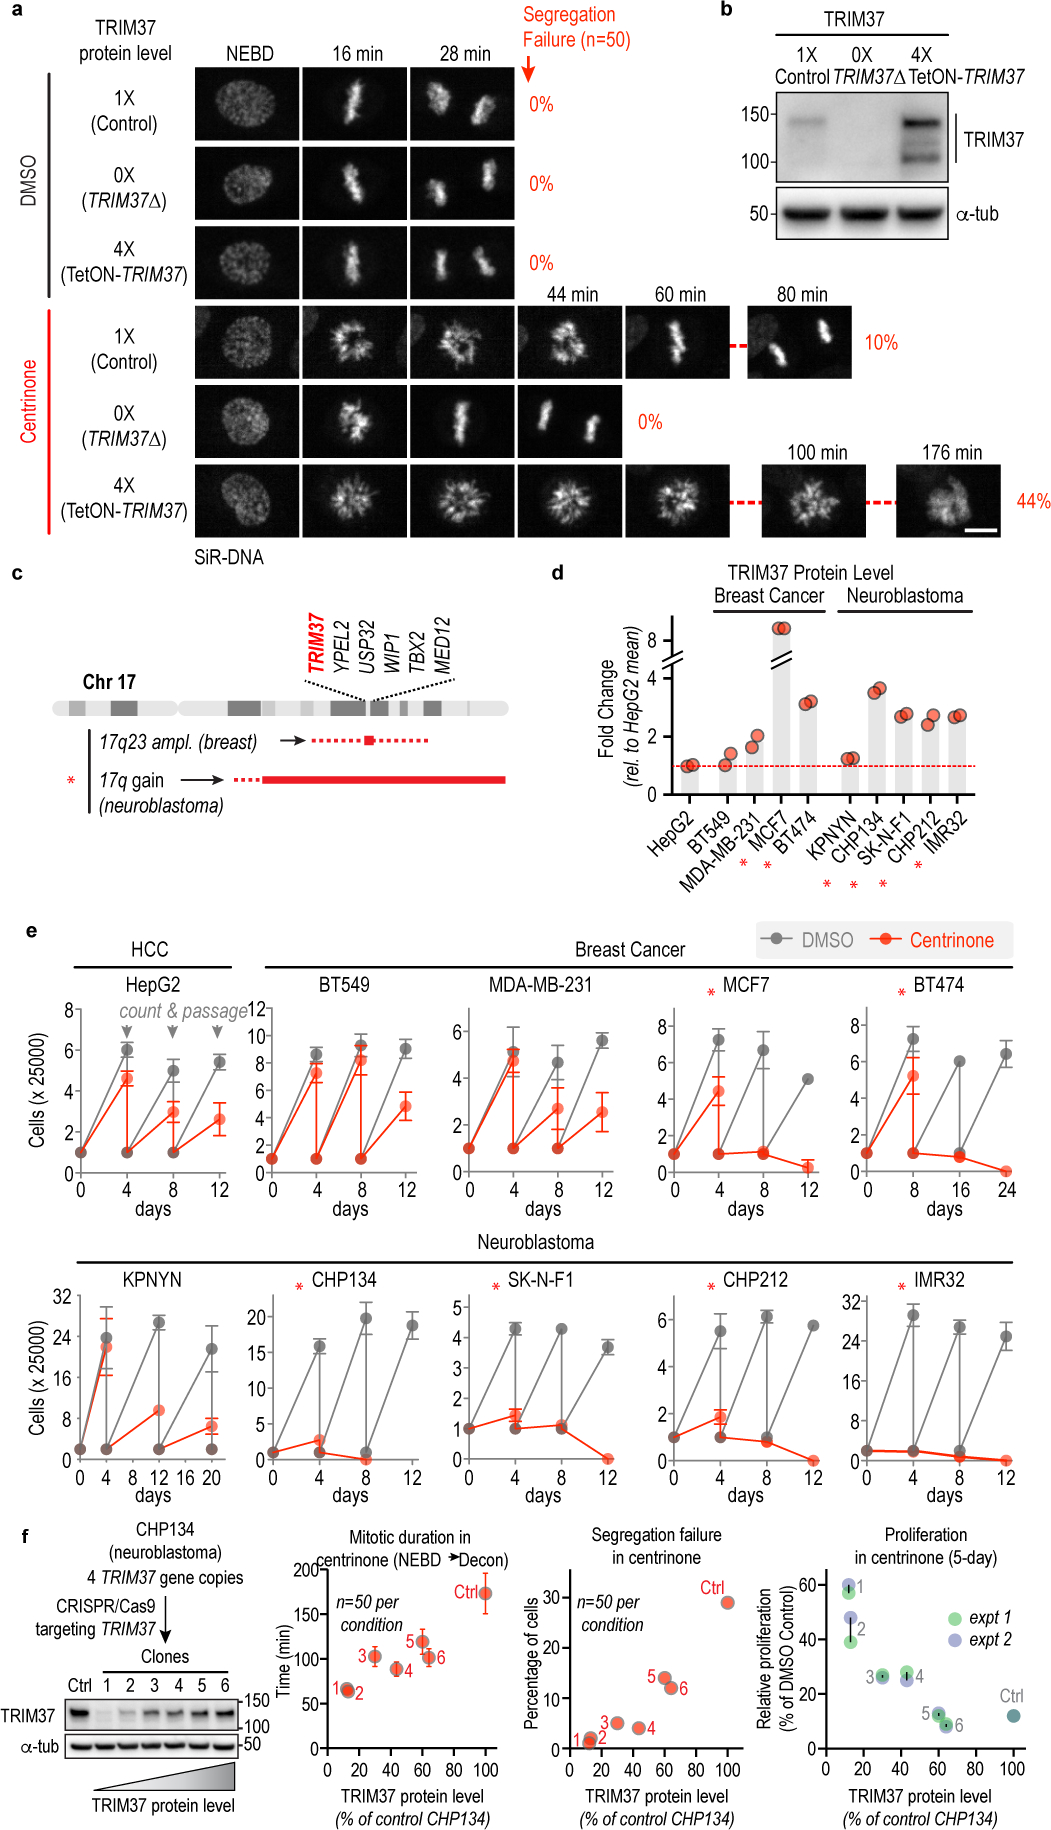
Figure 1. TRIM37 levels determine mitotic outcomes and cancer-specific sensitivity to PLK4 inhibition.

(a) Still images from timelapse sequences showing chromosomes in RPE1 cells with normal (1X), no (0X, TRIM37Δ) or 4-fold increased (4X) TRIM37 protein levels after treatment with DMSO or centrinone. Scale bar, 10 μm. Rates of chromosome segregation failure for the same conditions are also indicated. (b) Immunoblot shows TRIM37 in the 3 analyzed lines; α-tubulin serves as a loading control. (c) Schematic of the chromosome 17q region containing TRIM37 that is amplified in specific cancer contexts. (d) Graph shows TRIM37 protein level, measured by semi-quantitative immunoblotting, for the indicated breast cancer and neuroblastoma cell lines. (e) Passaging-based proliferation analysis for the indicated cell lines treated with DMSO (grey) or centrinone (red). (f) (left) Immunoblot of CHP134 clones in which CRISPR/Cas9-based inactivation of 1 or more of the 4 TRIM37 gene copies was used to vary TRIM37 protein levels. α-tubulin serves as a loading control. (right) Graphs plot mitotic duration, chromosome segregation failure frequency, and proliferation in centrinone as a function of TRIM37 protein level in the engineered CHP134 cell lines. Error bars in mitotic duration are 95% CI. For gel source data see Supplementary Figure 1.
