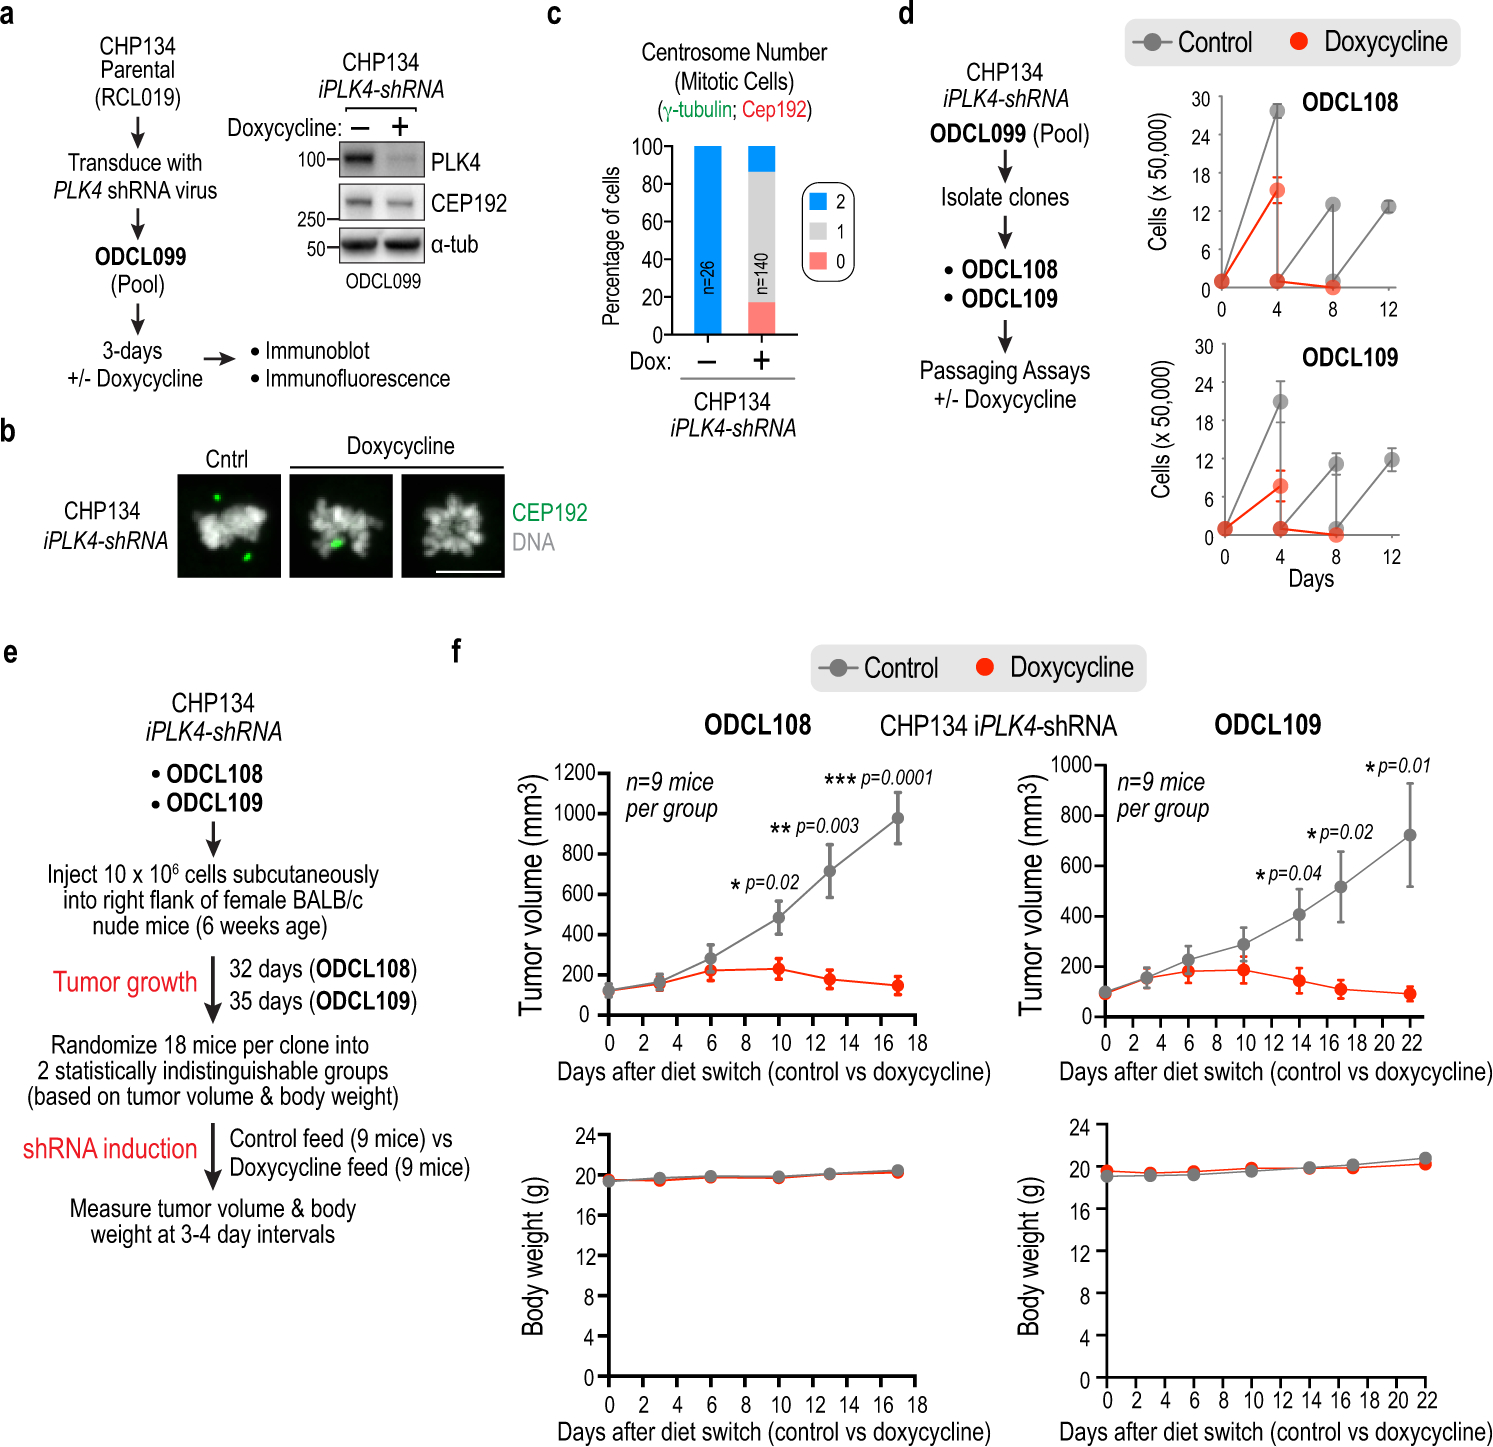
Extended Data Figure 7. Inducible PLK4 shRNA-based CHP134 xenograft tumor analysis.

(a) (left) Schematic illustrating the generation and characterization of a CHP134 pool with stably integrated inducible PLK4 (iPLK4) shRNA. Following viral transduction, 3 day-induction of the shRNA with doxycycline, immunoblotting and immunofluorescence was used to assess PLK4 depletion and centrosome loss. (right) Immunoblot shows depletion of PLK4 as well as reduction of CEP192, as is also observed with centrinone; this reduction was dependent on high TRIM37 expression in CHP134 cells, as it was not observed following induction of PLK4 shRNA in a CHP134-derived line with ~10% TRIM37 expression (not shown). (b) Immunofluorescence images showing loss of centrosomes, detected using CEP192, following induction of PLK4 shRNA. Scale bar, 10 μm. (c) Quantification of centrosome number after 3-day induction of PLK4 shRNA. Longer induction was associated with extensive lethality, as is also observed with centrinone treatment of CHP134 cells. (d) (left) Schematic of isolation of CHP134 clones with stably integrated iPLK4 shRNA from the pool described in (a-c). (right) Results of passaging-based analysis showing that both clones exhibited rapid cessation of proliferation following induction of the shRNA. (e) Schematic of the workflow for tumor xenograft analysis with the two CHP134 iPLK4-shRNA clones. Tumors were generated in female BALB/c nude mice, and the shRNA was induced by switching to a doxycycline-containing diet. Tumor volume and body weight were measured over time after induction. (f) Time course of tumor growth in BALB/c nude mice for the two CHP134 PLK4 shRNA clonal lines following induction of shRNA (Doxycyline) versus no induction (Control). Error bars are SEM. Statistical significance was evaluated using unpaired t-tests. For gel source data see Supplementary Figure 1.
