
Figure 3. Acentrosomal spindle assembly and pericentriolar material coalescence is suppressed by elevated TRIM37 in PLK4-inhibited cells.
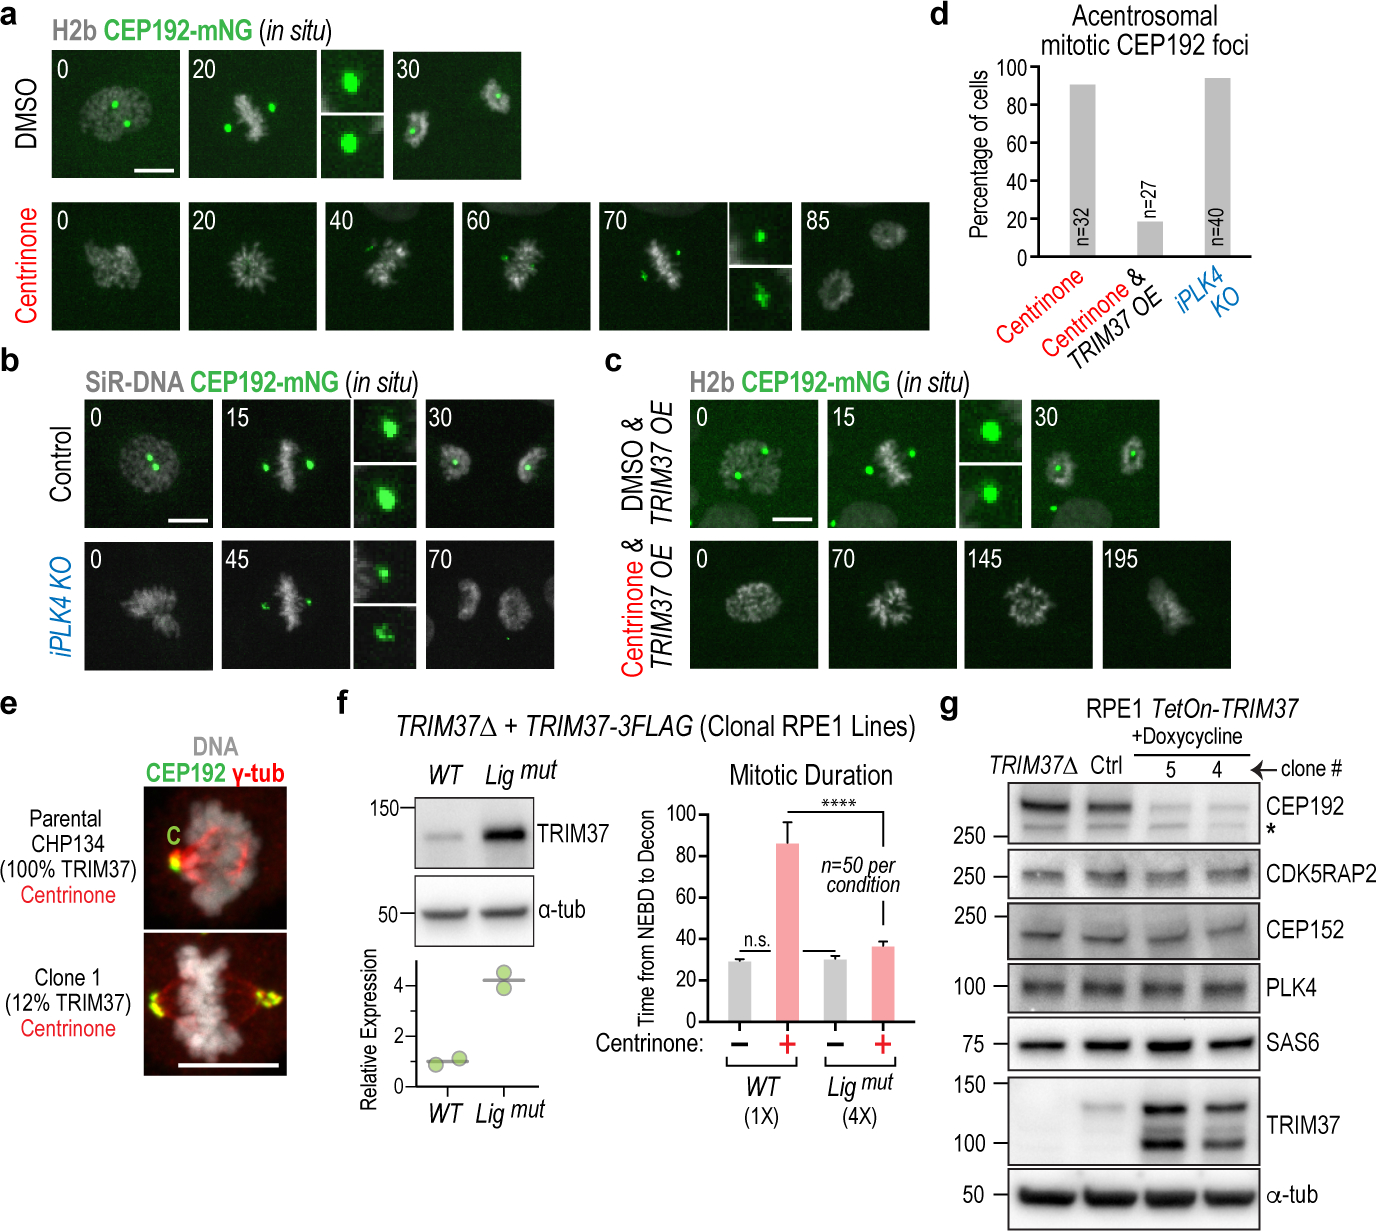
(a) Images of mitosis in DMSO or centrinone-treated RPE1 cells expressing in situ mNG-tagged CEP192. Acentrosomal spindle assembly in centrinone-treated cells is accompanied by CEP192 coalescence into foci at the spindle poles. Times are minutes after NEBD. (b) Images of mitosis in control and PLK4 knockout cells expressing in situ mNG-tagged CEP192, showing that formation of foci at the spindle poles does not require PLK4 protein. Times are minutes after NEBD. (c) Images of mitosis in TRIM37-overexpressing cells with in situ mNG-tagged CEP192 following treatment with DMSO or centrinone. Elevated TRIM37 expression suppresses coalescence of pericentriolar material components and frequently results in cells exiting mitosis without segregating their chromosomes. Times are minutes after NEBD. (d) Frequency of CEP192 coalescence to form mitotic foci for the indicated conditions. (e) Images of centrinone-treated mitotic CHP134 neuroblastoma parental cells or a clone with reduced TRIM37 expression (Fig. 1f). Acentrosomal foci are only at spindle poles following TRIM37 reduction in this TRIM37-amplified cell line. C: centrosome. (f) Ligase activity is required for elevated TRIM37 to increase sensitivity to PLK4 inhibition. (left) WT or ligase-inactive TRIM37 were expressed in TRIM37Δ RPE1 cells and clonal lines isolated; WT TRIM37 was expressed at a level comparable to endogenous TRIM37 (not shown); ligase-inactive TRIM37 was expressed at a ~4-fold higher level. (right) 4-fold overexpression of ligase-inactive TRIM37 suppresses, rather than enhances, mitotic defects in centrinone. (g) Effect of elevated TRIM37 expression on the indicated centrosomal components. CEP192 levels declined significantly whereas other tested components were not significantly affected. Asterisk marks a background band. α-tubulin serves as a loading control in (f) and (g). Scale bars are 10 μm. For gel source data see Supplementary Figure 1.