
Extended Data Figure 1. Effect of varying TRIM37 levels on sensitivity to PLK4 inhibition and TRIM37 expression profile in patient-derived tumors and cancer cell lines.
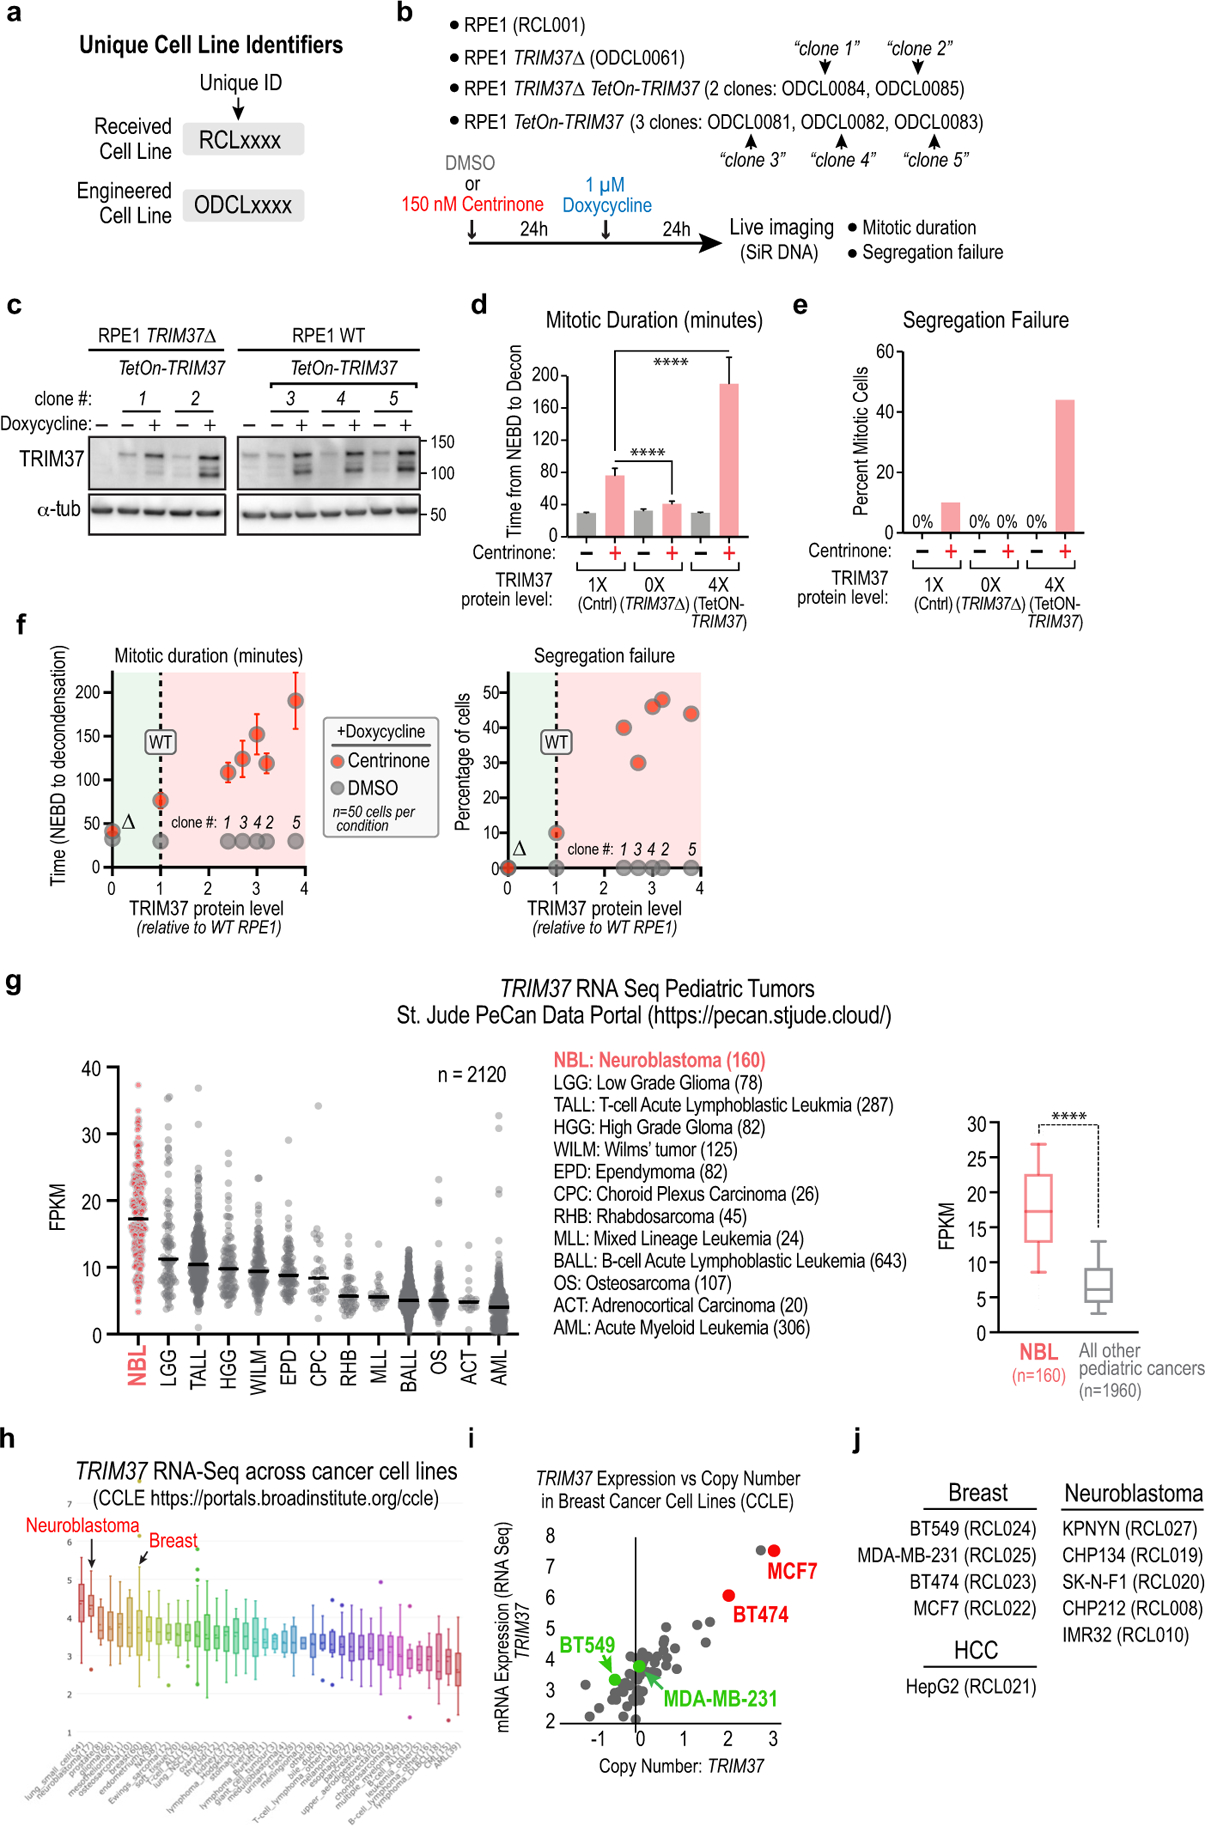
(a) Unique cell line identifiers are used to describe the cell lines in each experiment. The RCL prefix refers to cell lines received from an external source, such as the American Type Culture Collection (ATCC). The ODCL prefix refers to cell lines engineered from received cell lines. (b) Cell line code and experimental protocol for the analysis of mitotic duration and chromosome segregation failure. Clone 5 is the Tet-ON TRIM37 cell line shown in Fig. 1a,b, which overexpresses TRIM37 ~4-fold relative to parental RPE1 cells. (c) Immunoblots of the RPE1 cell lines described in (b); transgene-encoded TetON-TRIM37 expression was induced for 24h. (d,e) Graphs plotting mitotic duration (d) and the frequency of chromosome segregation failure (e) following treatment with DMSO (−) versus centrinone (+) for the 3 analyzed cell lines shown in Fig. 1a,b; n= 50 for each condition. Error bars are 95% CI. (f) Live imaging-based analysis was used to measure mitotic duration and segregation failure for the cell lines described in (b); values are plotted versus TRIM37 protein level measured by semi-quantitative western blotting. Each cell line was treated with DMSO (grey) or centrinone (red) and doxycycline before live imaging – experimental scheme is shown in panel (b). 50 cells were analyzed per condition. Error bars are 95% CI. In DMSO, the analyzed cell lines exhibited normal mitotic duration and segregation fidelity regardless of TRIM37 protein level. By contrast, in centrinone, loss of TRIM37 reduced mitotic duration and segregation failure percentage (green shading) whereas increased TRIM37 protein levels led to a proportional increase in mitotic duration and segregation failure rate (red shading). (g) (left) Graph plotting TRIM37 mRNA level in 2120 pediatric tumors, representing 13 different cancer types (data is from the St. Jude PeCan Data Portal15). All pediatric cancer types with >10 tumors analyzed are shown. Values for individual tumors (dots) and the median value (black lines) are plotted. The 3-letter codes to the right of the graph describe the 13 pediatric cancer types. Neuroblastoma tumors exhibit the highest TRIM37 expression. (right) Box-and-whiskers plot, comparing TRIM37 mRNA levels in neuroblastoma tumors to that all other pediatric cancer type tumors. The range represents 10–90th percentile of the data; the p-value shown is from an unpaired t-test. (h) Graph plotting TRIM37 mRNA levels across cancer cell lines described in the Cancer Cell Line Encyclopedia (CCLE16; https://portals.broadinstitute.org/ccle). (i) mRNA expression versus copy number from CCLE data for breast cancer cell lines. Two cell lines with high TRIM37 copy number and expression (MCF7 and BT474; red), as well as two cell lines with normal copy number and expression (MDA-MB-231 and BT549; green) are marked. (j) List of breast cancer and neuroblastoma cell lines used for analysis in Fig. 1d–e. HepG2 is a hepatocellular carcinoma-derived cell line with similar TRIM37 expression to control RPE1 cells. For gel source data see Supplementary Figure 1.