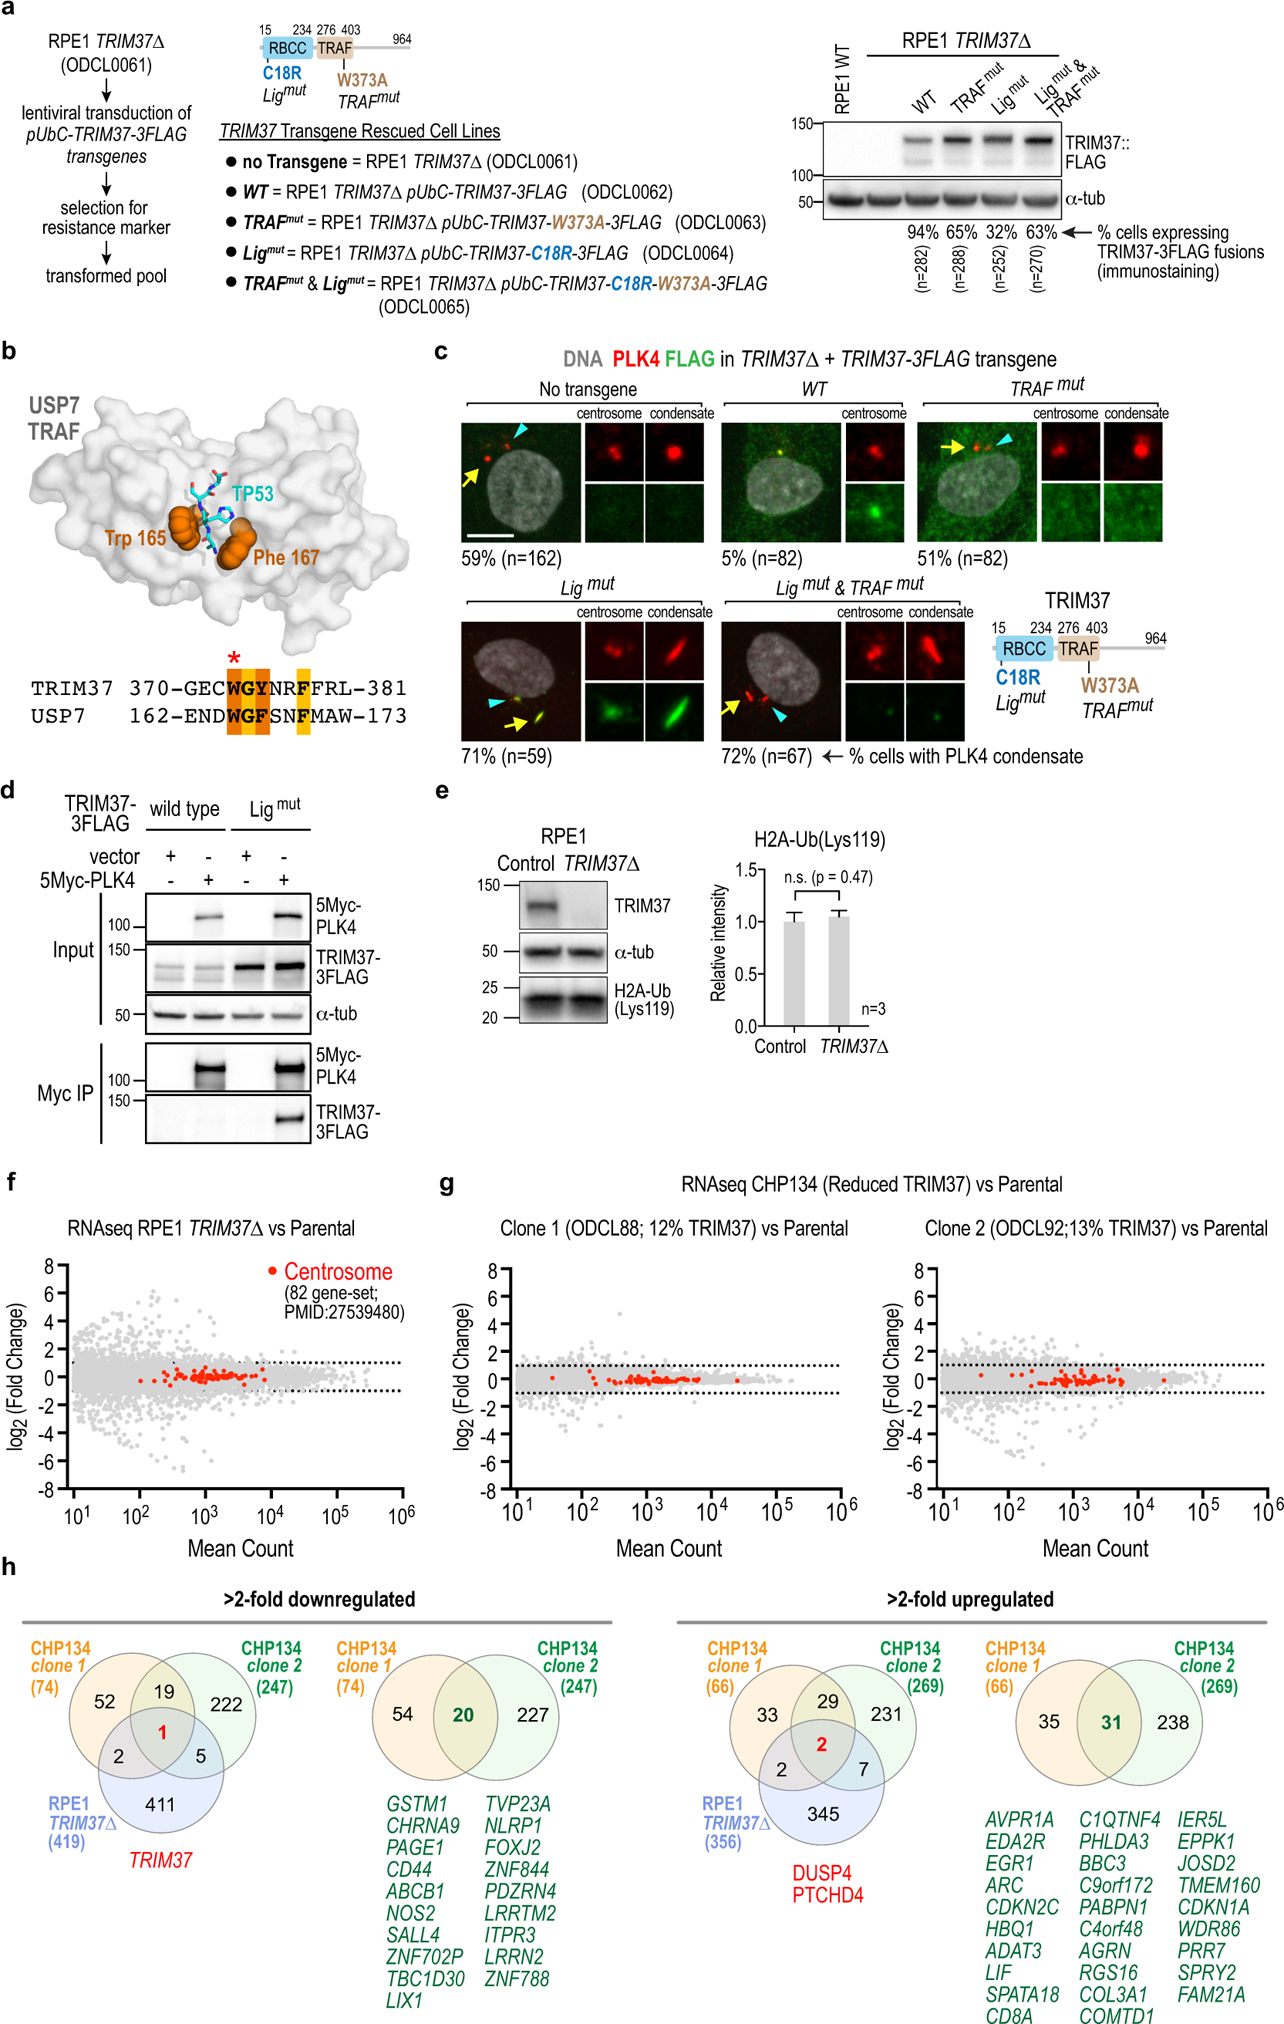
Extended Data Figure 4. Generation of TRIM37 variants and analysis of the effect of TRIM37 loss on H2a ubiquitination and transcription.

(a) (left) Method used to generate cell lines for testing rescue with transgenes encoding wildtype and mutant variants of TRIM37. Schematic of TRIM37 shows the point mutants engineered in the ligase and TRAF domains. (right) Blot shows expression of transgene-encoded TRIM37 variants in the pools selected for marker resistance; percentage of cells expressing the indicated fusions is shown below the blot. (b) Structural homology-based strategy used to engineer the TRIM37 TRAF domain mutant. Diagram illustrates the USP7 TRAF domain (gray surface) bound to a p53 peptide (cyan stick) with key binding residues W165 and F167 in orange spheres (PDB:3MQR). Sequences below show similarity between TRIM37 and USP7 in the peptide binding pocket; the conserved tryptophan (W165 in USP7; W373 in TRIM37) was mutated to alanine to generate the TRIM37 TRAF mutant. (c) Images illustrating the effect of expressing WT TRIM37 or engineered variants disrupting ligase activity or TRAF domain interactions in TRIM37Δ cells. (d) Interaction analysis employing co-expression of TRIM37 and PLK4 followed by PLK4 immunoprecipitation. Wild-type (WT) TRIM37 is expressed at significantly lower levels than ligase-mutant (C18R) TRIM37, suggesting that TRIM37 autoregulates its own stability. The low expression of WT TRIM37 led us to use ligase-mutant TRIM37 for the interaction analysis shown in Fig. 2i. (e) (left) Immunoblot of H2A-Ub(Lys119), comparing control and TRIM37Δ RPE1 cells. α-tubulin serves as a loading control. (right) Quantification of band intensities indicates that TRIM37 does not reduce ubiquitination of Lys119 in histone H2A. (f) RNA-Seq analysis comparing parental and TRIM37Δ RPE1 cells. A previously defined set of 82 genes encoding centrosomal components43 is marked in red to highlight lack of change in their mRNA levels. (g) RNA-Seq analysis comparing parental CHP134 cells to two clones with significantly lower expression of TRIM37. The two clones shown are clone 1 and clone 2 in Fig. 1f. The centrosome 82-gene set is highlighted in red. (h) Lists of >2-fold downregulated or upregulated genes. Each of the 3 test lines (RPE1 TRIM37Δ, CHP134 clone 1, CHP134 clone 2) was compared to the parental line in order to identify genes with statistically significant >2-fold changes. Cross-comparison of all 3 test lines and of the 2 CHP134 clones is summarized in the Venn diagrams; gene names for shared differentially expressed genes are shown below each Venn diagram. For gel source data see Supplementary Figure 1.
