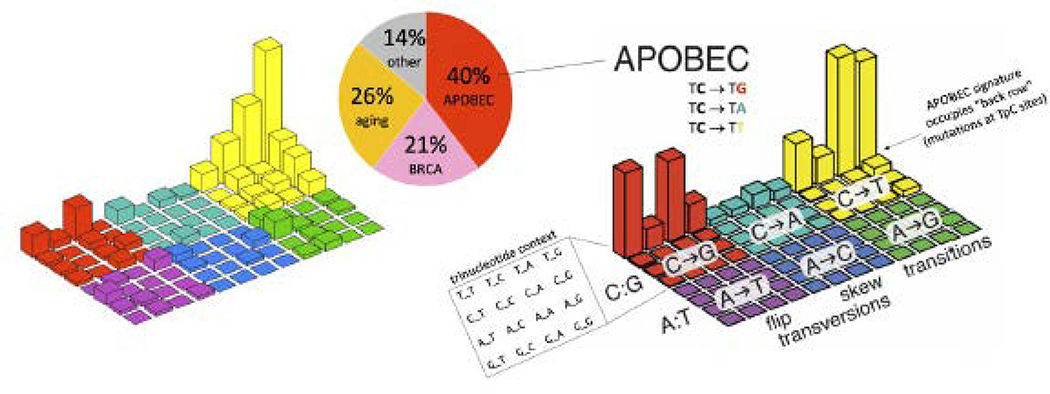
Figure 2. APOBEC mutation signature in somatic BRCA-mutant patients.
The “Lego” plot on the left is the study data (all somatic mutations in the cohort). The “Lego” plot on the right is a “reference” for comparison: the APOBEC mutation signature. It also has the plot axes labeled. The rows are not mutational signature, but rather the whole plot is a mutation signature. The APOBEC mutation signature was clearly observed in this cohort. Approximately 40% of mutations were assignable to the APOBEC mutation signature (back row of bars in the “Lego” plot, COSMIC signatures 2+13), summing mutations across the 29 patients that were found to carry somatic BRCA mutations. Other contributors to the mutations in these BRCA-mutant patients were the “aging” signature (COSMIC Signature 1) and the “BRCA” signature (COSMIC Signature 3).

