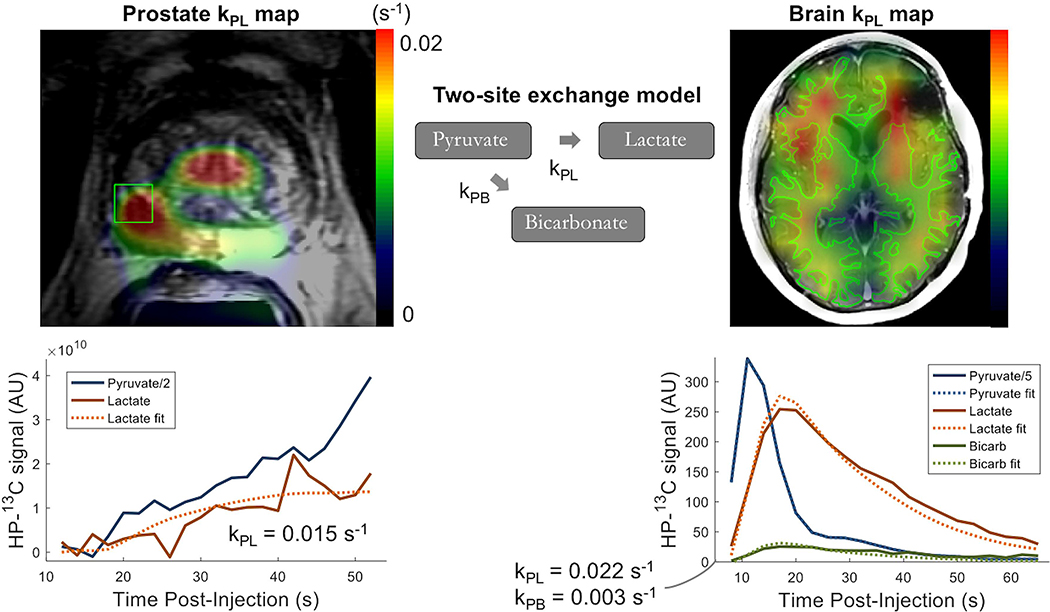
Figure 8. EPSI/EPI-derived kPL Maps.
Example kPL maps from human patient studies based on the fitting of dynamic HP [1-13C]lactate production using the input-less kinetic modelLeft: EPSI Kpl map overlaid on a T2-weighted image from a patient with prostate cancer, with dynamic metabolite traces shown for the voxel indicated in greenRight: EPI kPL map overlaid on a T1 post-contrast 1H image from a patient treated for malignant brain tumor, with both HP [1-13C]lactate and [13C]bicarbonate production depicted within the highlighted region of normal-appearing white matter.

