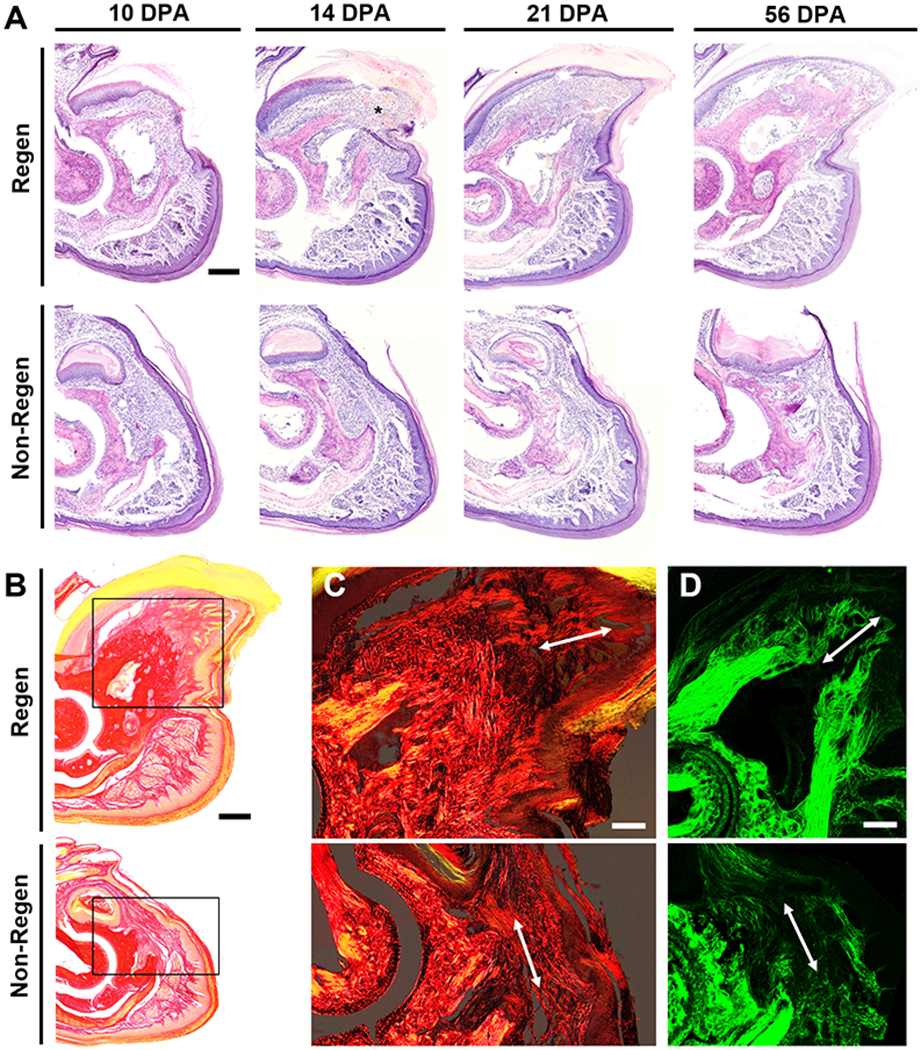
Fig. 3. Histological time course of regeneration.

(A) Hematoxylin and Eosin (H&E) staining at various DPA for Regen and Non-Regen groups. Asterisk indicates blastema at 14 DPA. Scale: 0.2 mm. (B) Picrosirius Red (PSR) staining imaged with bright field microscopy at 21 DPA. Scale: 0.2 mm. Inset shows area imaged in (C). (C) PSR staining visualized with polarized light microscopy and (D) second harmonic generation (SHG) imaging show collagen fibers (arrow) extending proximodistally in the Regen but not the Non-Regen state at 21 DPA. Scale: 0.1 mm.
