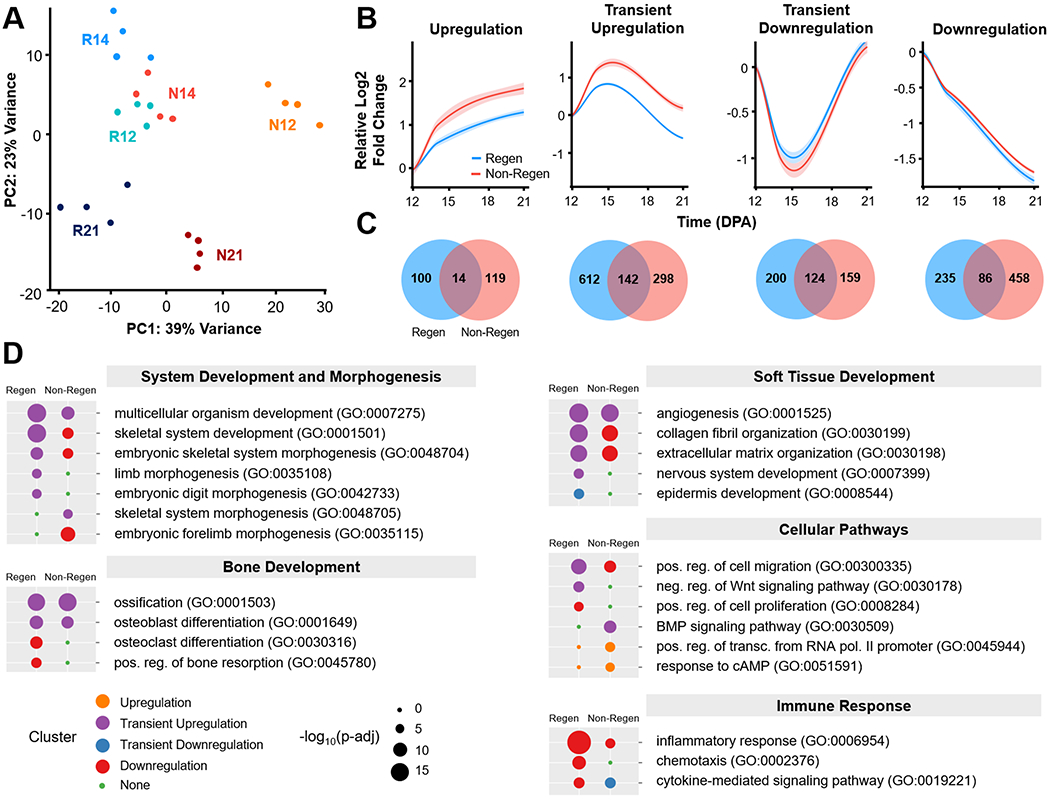
Fig. 4. Temporal transcriptomic dynamics of regeneration competency versus failure.

(A) Principle component analysis (PCA) illustrates the relative similarity between Regen (R) and Non-Regen (N) groups at 12, 14, and 21 DPA (n=4 mice, 4 digits/group/time point). (B) K-means clustering identified four differentially expressed gene (DEG) clusters with similar temporal expression patterns for each group. Solid lines represent the relative log2 fold change in expression level (RPKM) compared to 12 DPA. Lighter shades indicate 95% confidence interval. (C) Venn diagrams show number of DEGs present in Regen, Non-Regen, or both groups for each cluster. (D) Relevant GO terms (biological processes) for Regen and Non-Regen groups, where the circle color and size represent cluster type and Benjamini corrected p-value (p-adj), respectively.
