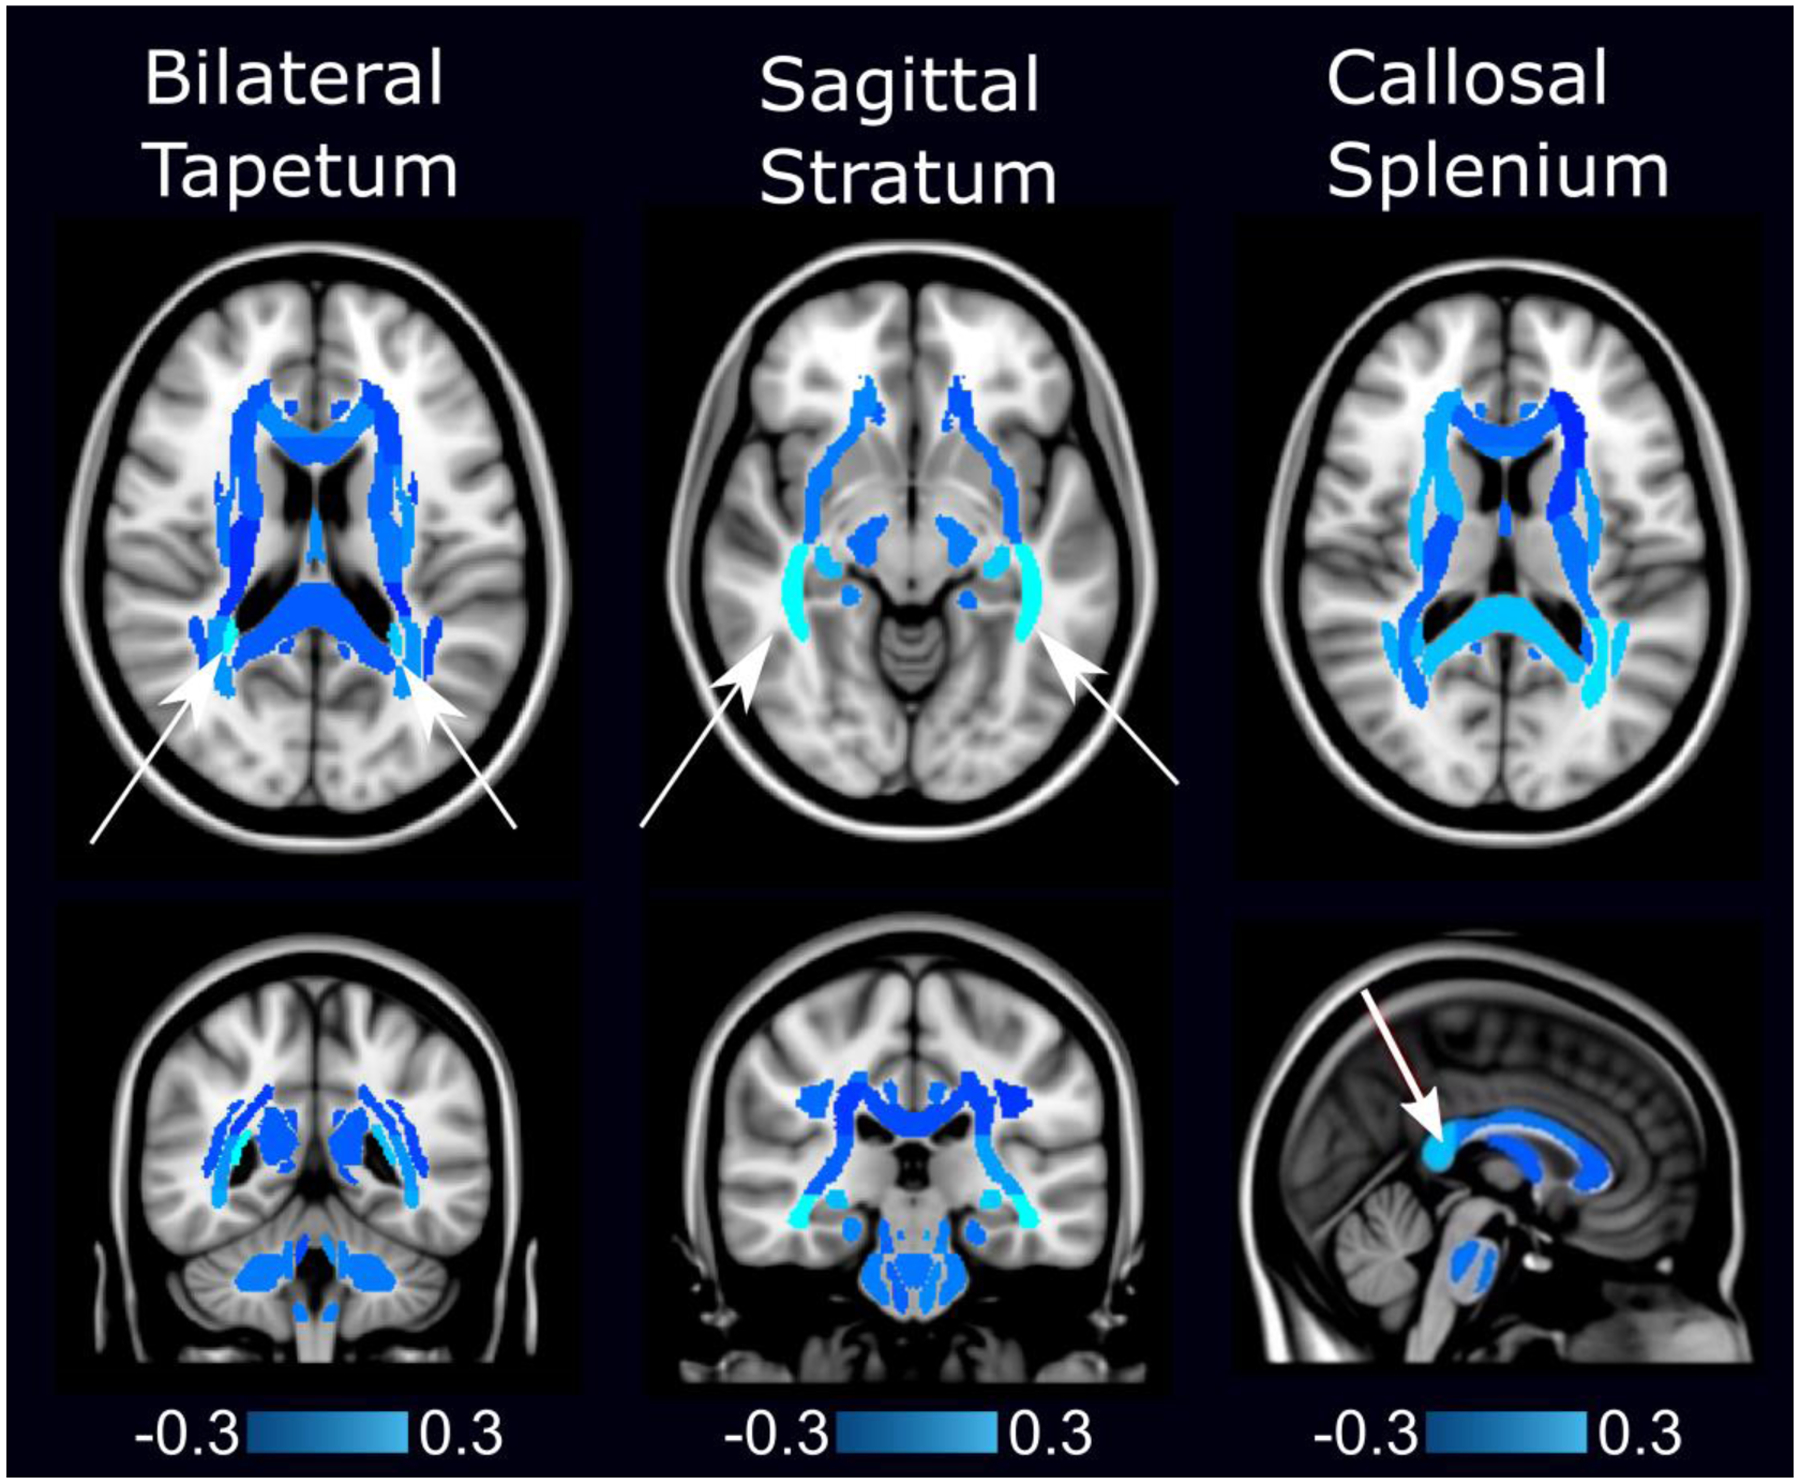
Fig. 1.

Edge density imaging map shows specific white matter regions of group results (arrows) that distinguish children with mild traumatic brain injury (TBI) from controls, projected onto the standard single-subject Montreal Neurological Institute (MNI) brain template [38]. (Table 1 details participant demographics.) In this figure, light blue regions are associated with higher edge density in controls (mean age 14.2 years, 50% female) compared to those with mild TBI (mean age 14.2 years, 36% female). Dark blue regions are associated with the opposite. The bilateral tapetum, sagittal stratum, and the splenium of the corpus callosum have higher edge densities in controls compared to children with mild TBI, and these differences are the most predictive features for accurate classification
