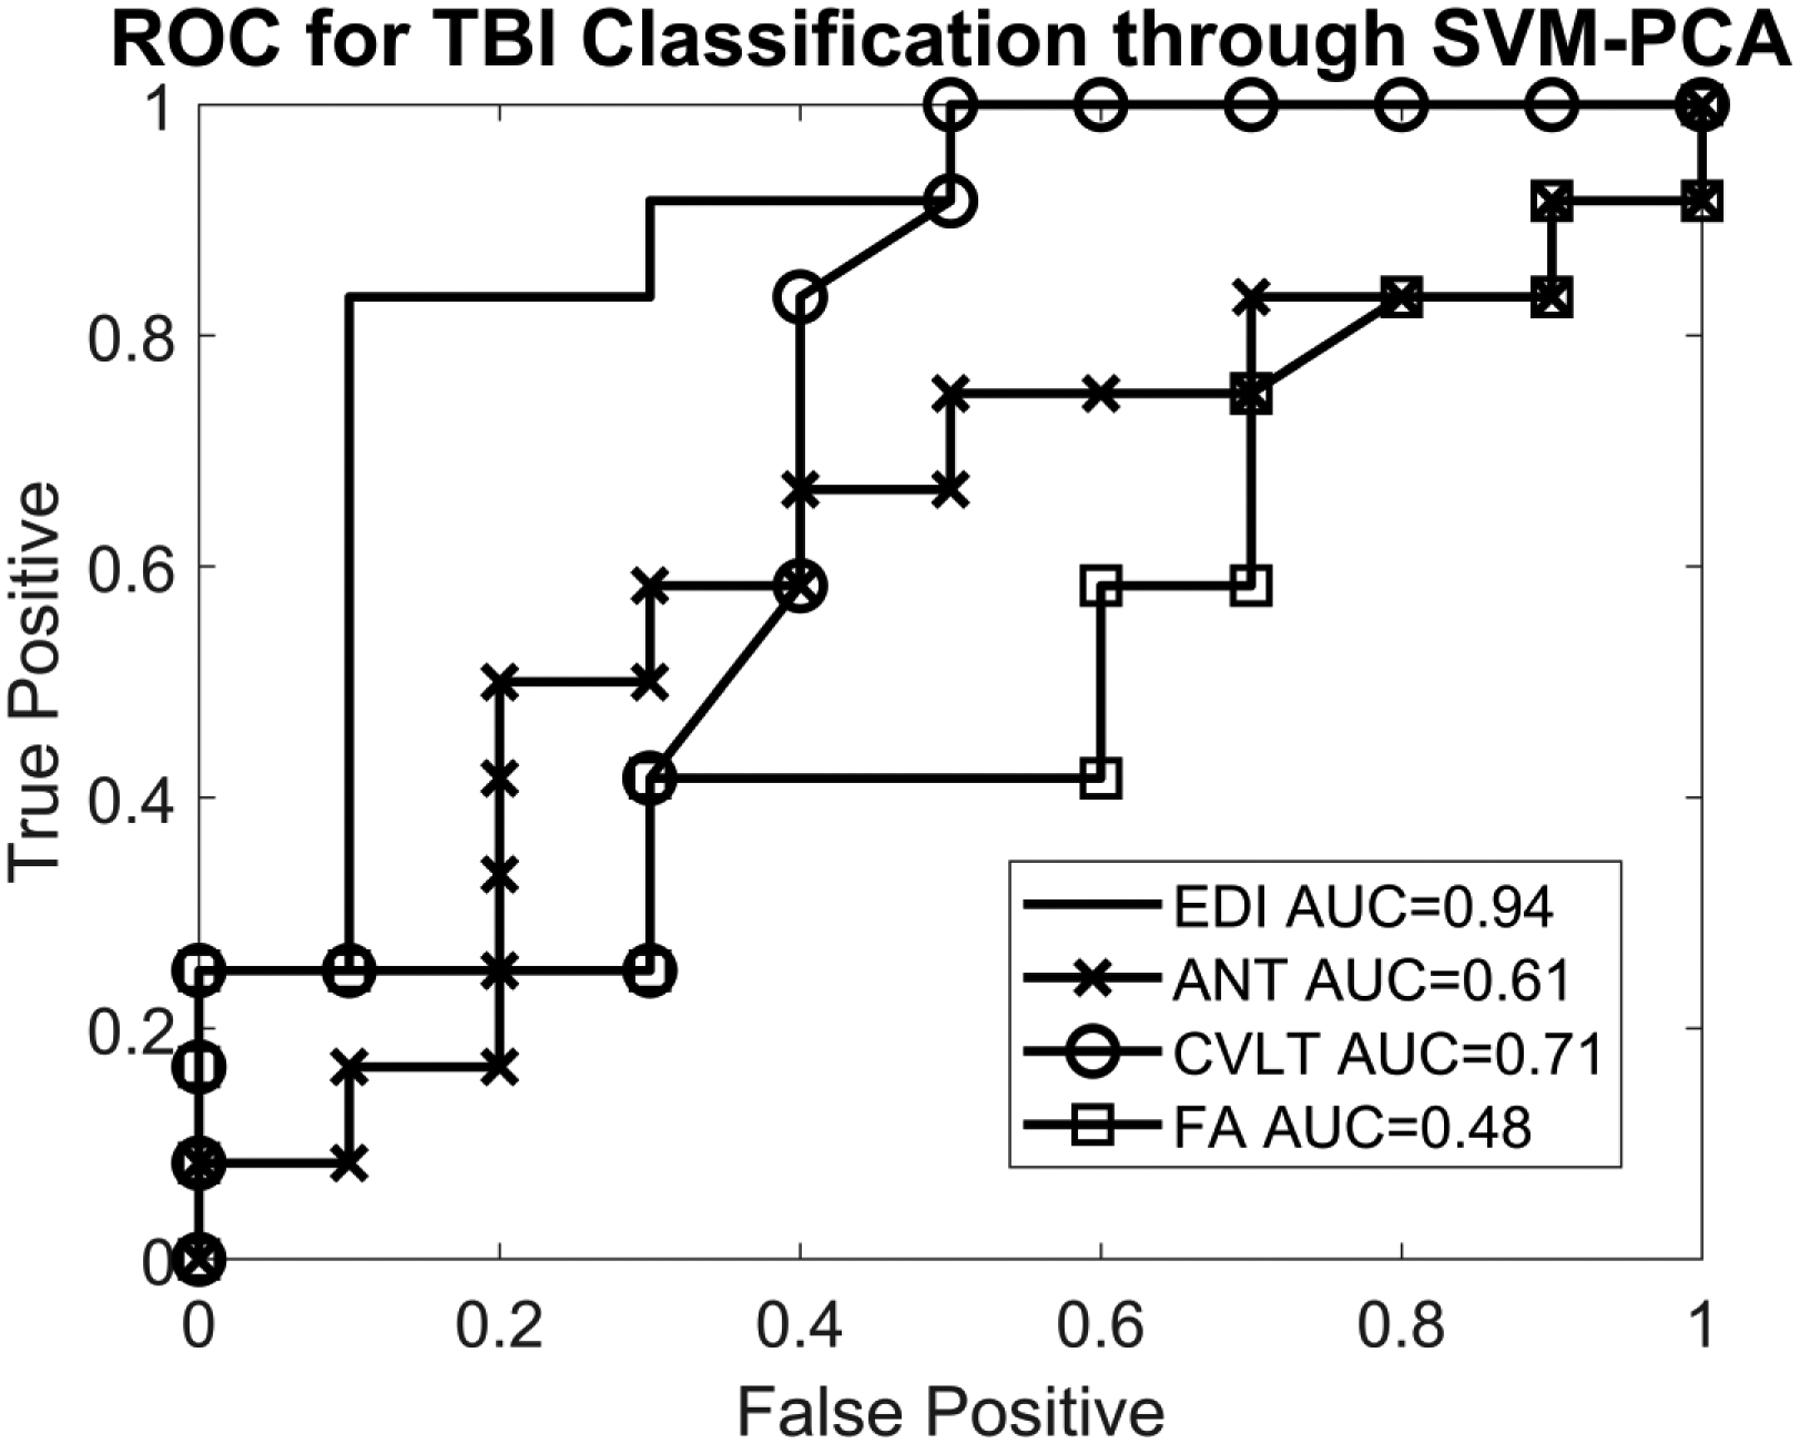
Fig. 2.

Receiver operating characteristic (ROC) curve for support vector machine (SVM)–principal component analysis (PCA) predictors in differentiating pediatric mild traumatic brain injury (TBI) cases from controls. SVM and PCA were used to generate a “TBI predictor” under a leave-one-out cross-validation, and the ROC curves based on these predictors are plotted here. For edge density imaging, the area under the curve (AUC) was 94%. Fractional anisotropy (FA) values resulted in an AUC of 48% in distinguishing children with mild TBI from controls. Neurocognitive testing yielded an AUC of distinguishing children with mild TBI from controls ranging from 61% with the Attention Network Task (ANT) to 71% with the California Verbal Learning Test (CVLT). No statistically significant correlations were observed between neurocognitive test results and either the diffusion tensor imaging (DTI) scalars or the edge density imaging maps
