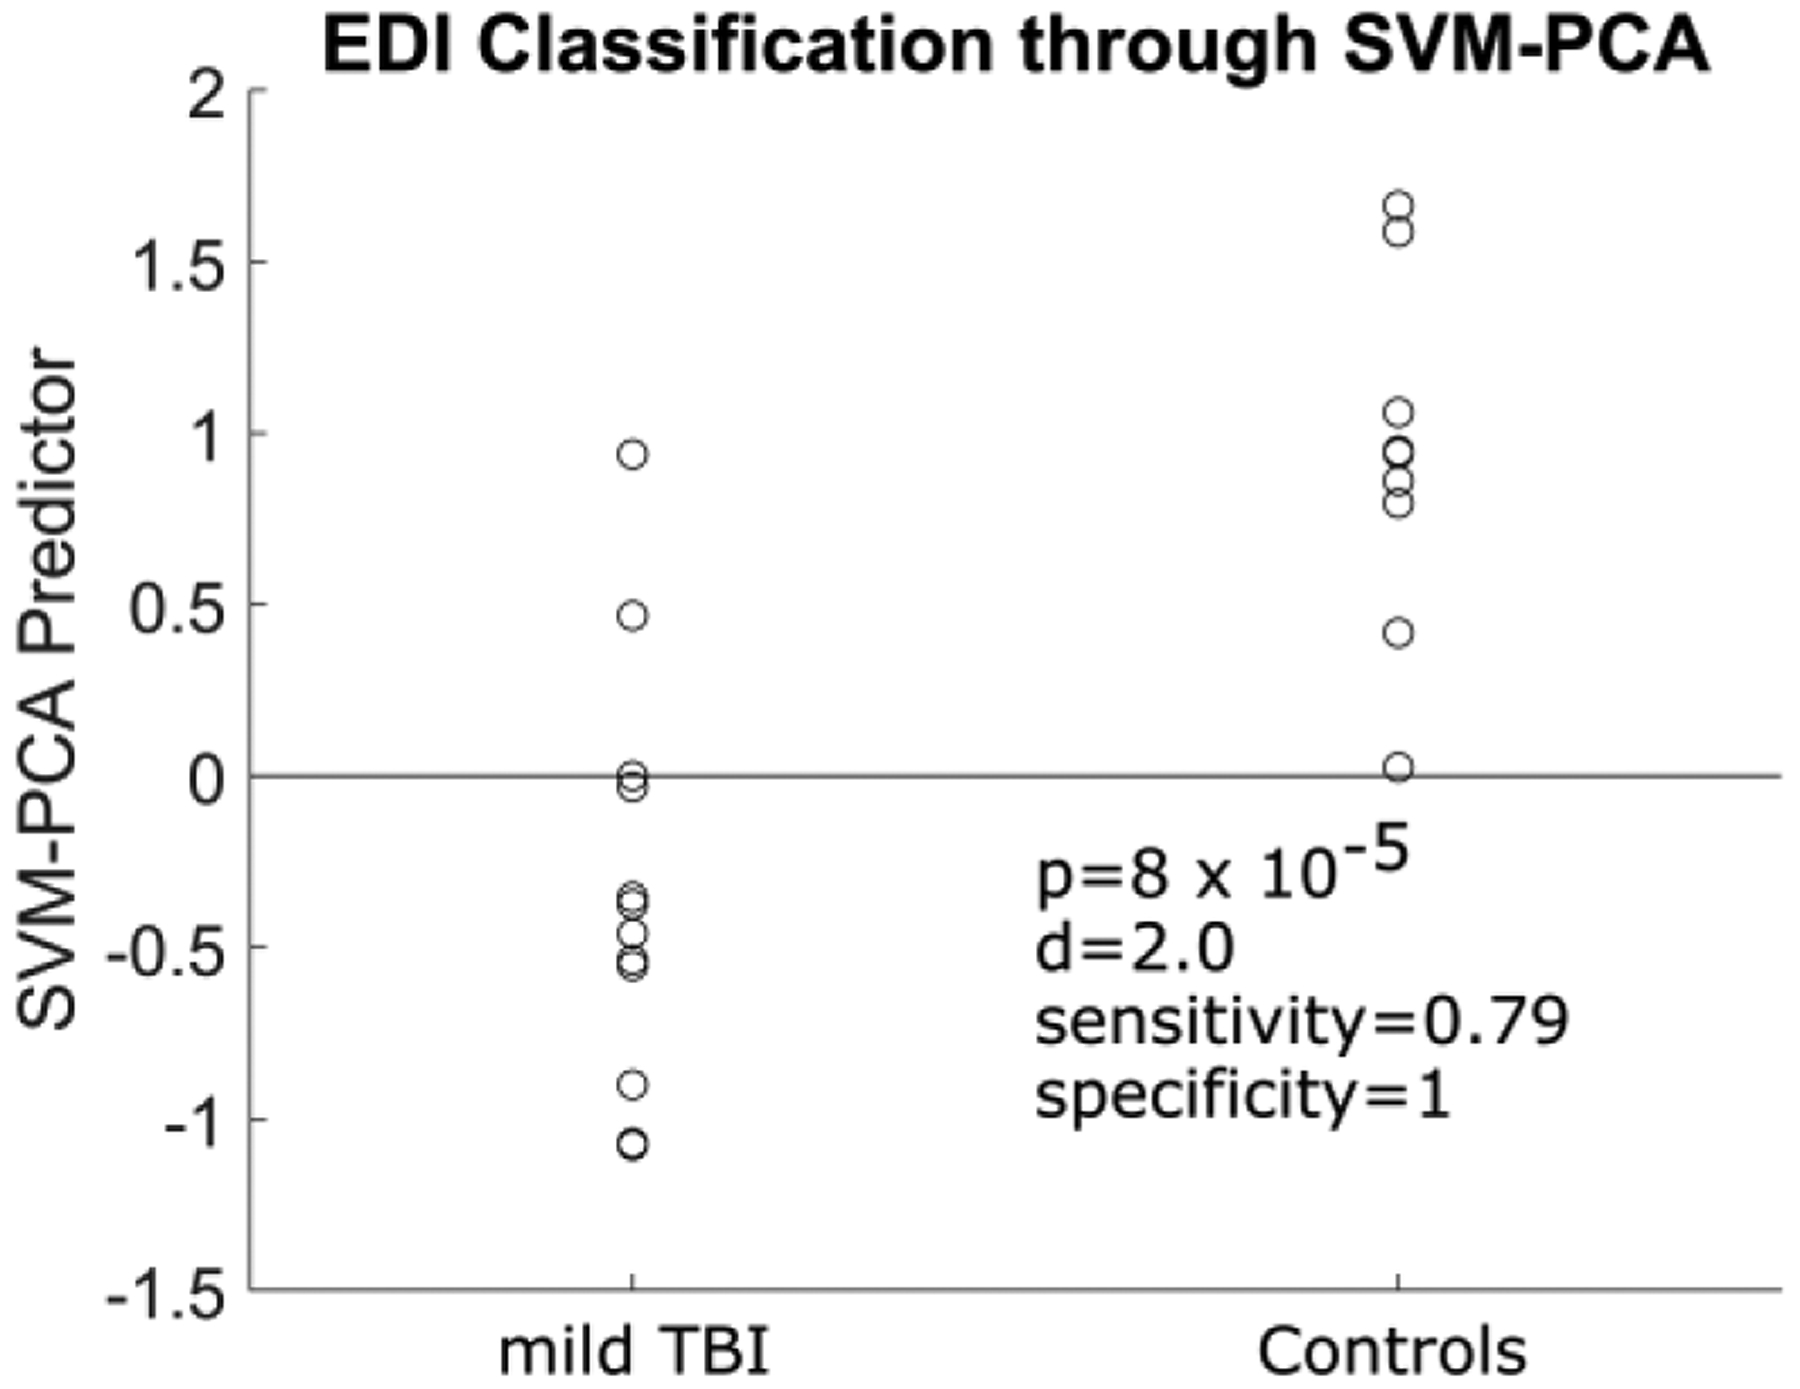
Fig. 3.

Individual control and mild traumatic brain injury (TBI) cases and their distances from the support vector machine hyperplane (gray line). A positive distance in this figure is noted with controls, and a negative distance with mild TBI cases. EDI edge density imaging, SVM-PCA support vector machine–principal component analysis
