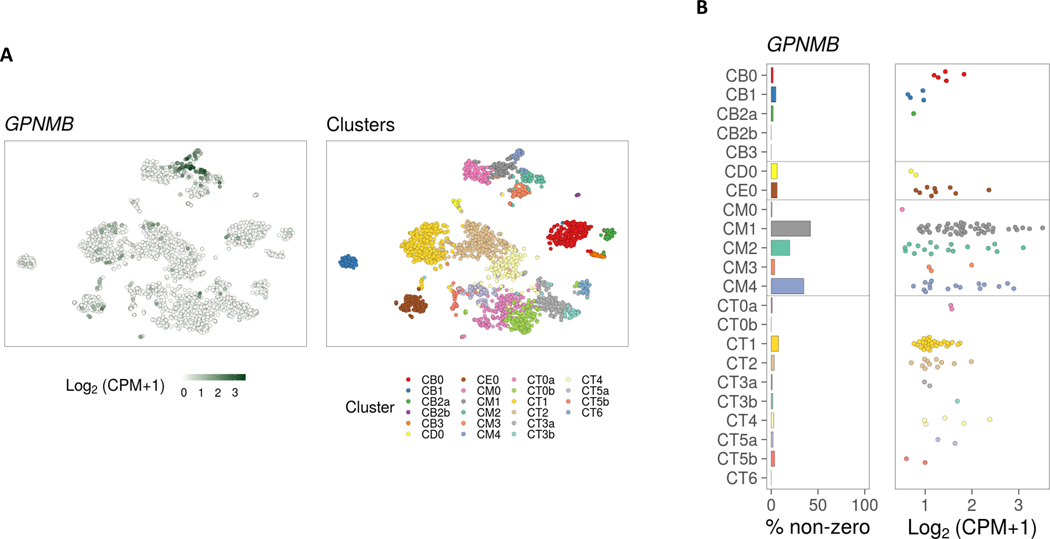
Figure 2. GPNMB expression in kidney biopsy tissue in lupus nephritis.
(A) TSNE plot generated from unsupervised clustering analysis of single cell RNA-seq data from kidney biopsies of lupus patients generated by the Accelerating Medicines Partnership (AMP) project (right panel). Feature plot showing GPNMB expression, revealing 3 myeloid cell clusters with GPNMB expression (CM1, CM4, and CM2) (left panel). (B) Bar plot showing percentage of GPNMB expressing cells in kidney-infiltrating cell clusters and dot pot showing relative GPNMB expression levels. This figure was generated using the viewing browser https://immunogenomics.io/ampsle/. CM0, Inflammatory CD16+ machrophages; CM1: Phagocytic CD16+ macrophages; CM2, Tissue-resident macrophages; CM3, Conventional dendritic cells; CM4, M2-like CD16+ macrophages; CT0a, Effector memory CD4+ T cells; CT0b, Central memory CD4+ T cells; CT1, CD56dim CD16+ NK cells; CT2, Cytotoxic T lymphocytes; CT3a, Tregs; CT3b, TFH-like cells; CT4, GZMK+ CD8+ T cells; CT5a, Resident memory CD8+ T cells; CT5b, CD56bright CD16- NK cells; CT6, ISG-high CD4+ T cells; CB0: Activated B cells; CB1, Plasma cells/Plasmablasts; CB2a, Naive B cells; CB2b, Plasmacytoid dendritic cells; CB3, ISG-high B cells; CD0, Dividing cells; CE0, Epithelial cells.

