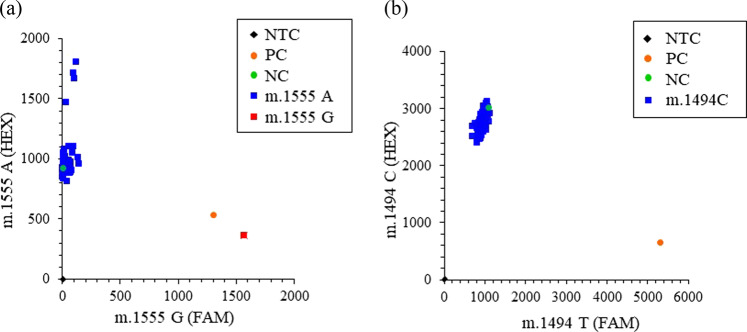
Fig. 2. Genetic testing for the mitochondrial DNA SNPs m.1555 A>G and m.1494 C>T.
a Genetic analysis of m.1555 A>G was performed using the TaqMan genotyping method. Representative data, including data for 1 patient with the m.1555 A>G mutation (red square) and participants with the m.1555 A genotype (blue squares), are shown as two-dimensional plots of m.1555 G amplification (FAM probe signal as the X-axis) and m.1555 A amplification (HEX probe signal as the Y-axis). b Representative data for the m.1494 C>T analysis are shown as a plot of m.1494 T amplification (FAM probe signal as the X-axis) and m.1494 C amplification (HEX probe signal as the Y-axis). All participants in this study were genotyped as m.1494 C (blue squares), and the m.1494 C>T mutation was not observed. The black diamond indicates the no-template control (NTC). The orange circle indicates the positive control (PC) [m.1555 A>G in (a) and m.1494 C>T in (b)]. The green circle indicates the negative control (NC) [m.1555 A in (a) and m.1494C in (b)].

