Figure 5.

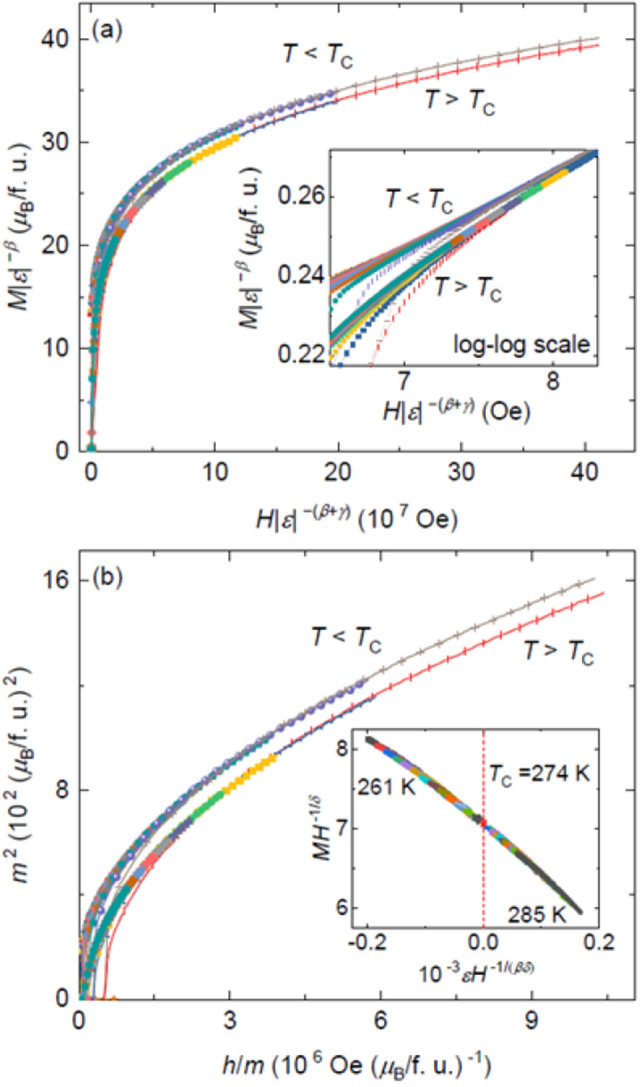
(a) The as a function of the below and above TC for Fe5GeTe2. Inset is the same m(h) data in log–log scale. (b) Plot in the form of m2(h/m) for Fe5GeTe2. Inset shows the plot of εH−(βδ) vs. MH−1/δ below and above TC.

(a) The as a function of the below and above TC for Fe5GeTe2. Inset is the same m(h) data in log–log scale. (b) Plot in the form of m2(h/m) for Fe5GeTe2. Inset shows the plot of εH−(βδ) vs. MH−1/δ below and above TC.