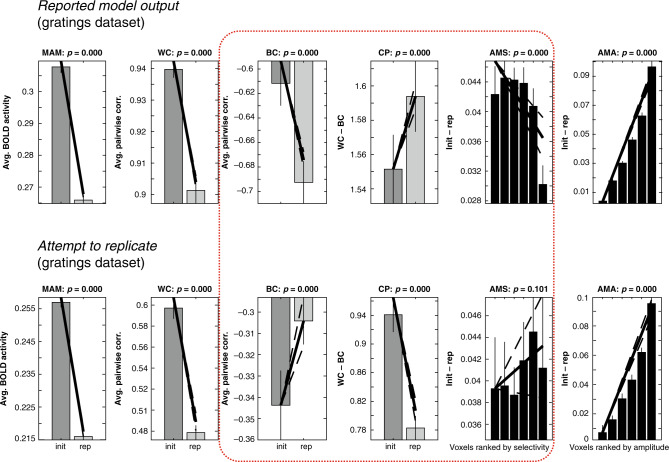
Fig. 1. Noise parameters influence feed-forward models of fMRI-pattern correlations.
Top row: pattern of results reported by Alink et al. for the winning parameter combination [a = 0.8, b = 0.4, σ = 0.4] for the grating dataset (cf. Supplementary Fig. 4 in Alink et al.). The direction (increase or decrease when comparing initial and repeated responses) of the six empirically observed data-features (cf. Figure 3 in Alink et al.) is only observed when uniformly distributed noise in the interval [0, 0.1] is added to the simulated brain patterns. Bottom row: the qualitative pattern of results observed for the winning parameter combination shown in the top row changed substantially when adding zero-mean Gaussian noise with a standard deviation of 0.1 instead of uniformly distributed noise. Of particular interest, the data-features BC, CP, and AMS are (shown within a red box) no longer qualitatively consistent with the empirical observations. Compare the corresponding slopes of lines in the top and bottom rows. Init initial presentation, rep repeated presentation, MAM mean amplitude modulation, WC within-class correlation, BC between-class correlation, CP “classification performance” (CP = WC − BC), AMS amplitude modulation by selectivity, AMA amplitude modulation by amplitude. Solid bars indicate mean of each condition and error bars 95% confidence intervals given the (simulated) between-participant variability. Diagonal lines indicate the slope of linear contrasts across conditions, and dashed lines indicate 95% confidence interval of the slope. See Alink et al. for methodological details and proposed interpretation of error bars and p values above each subpanel. In our view, given that arbitrary modeling choices determine the across-subject variability produced by the model, the reported error bars and accompanying p values have therefore little, if any, statistical meaning.

