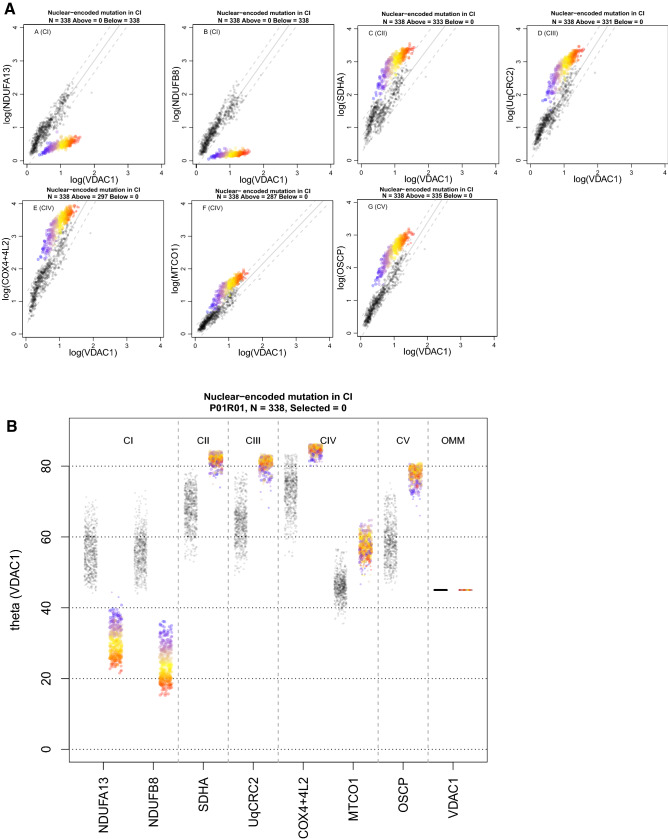
Figure 3.
Imaging mass cytometry (IMC) results from P01 with a nuclear-encoded complex I (CI) pathogenic variant in TMEM126B. One single-cell IMC measurement from the patient is represented by a coloured point in each panel. Control observations are in grey. Each plot represents an antibody observed during the IMC run. (A) 2Dmito plot view presents each oxidative phosphorylation marker plotted against VDAC1. Points representing patient fibres are coloured by theta for NDUFB8 for that fibre. Regression through the control data is drawn as a solid grey line and the 95% predictive interval for control fibres lies between the dashed grey lines. Total number of fibres above and below the dashed lines are written above each panel. (B) Theta plot shows for each individual fibre the angle that is generated between the point and the x-axis on the 2Dmito plots. Theta quantifies expression of each oxidative phosphorylation marker in the context of mitochondrial mass (VDAC1). Points representing patient fibres are coloured for expression (theta) of NDUFB8; red fibres have the lowest expression and blue fibres highest expression. Web Figure: p1.

